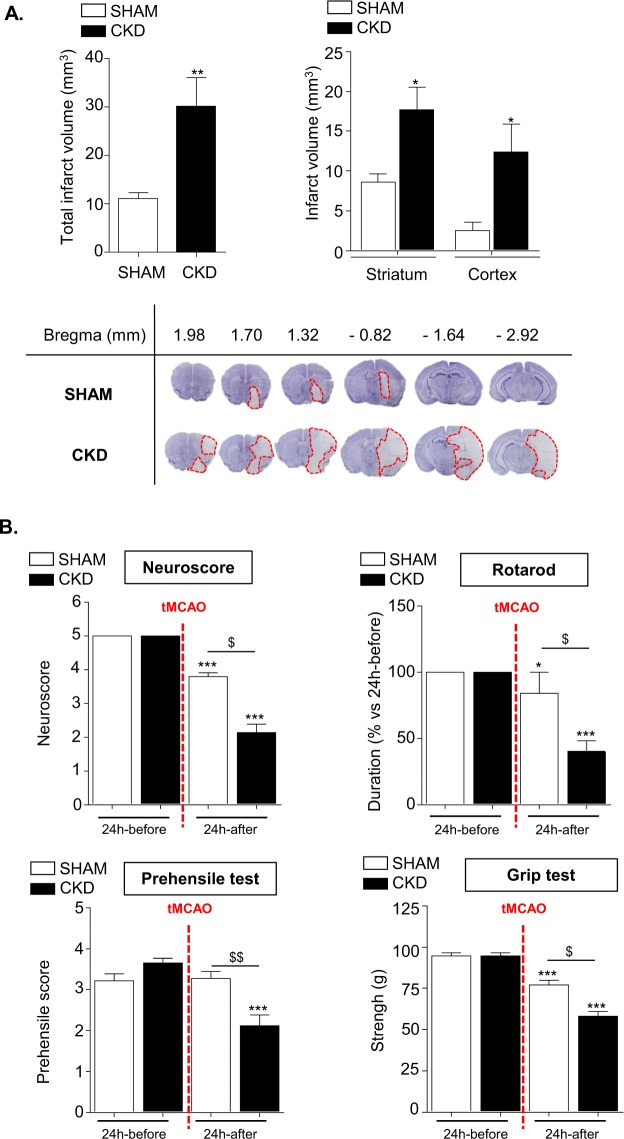
Figure 2.
CKD worsens infarct volumes and impairs mice functional recovery after tMCAO. (A) Analysis of total (upper left) as well as cortical and striatal (upper right) infarct volumes in SHAM and CKD animals. The lower panels show representative pictures of cresyl-violet staining. Results are expressed as mean ± SEM. *p < 0.05 and **p < 0.01, CKD versus SHAM mice (non parametric Mann-Whitney U test). SHAM mice: n = 14. CKD mice: n = 13. (B) Neurobehaviourial evaluation performed on SHAM (n = 24) and CKD (n = 25) mice 24 hours before and 24 hours after tMCAO. Results are expressed as mean ± SEM. Statistical analysis was performed with a non-parametric Kruskall-Wallis test followed by Dunn’s multiple comparison posttests. *p < 0.05 24 hours before versus 24 hours after tMCAO within each group, ***p < 0.001 24 hours before versus 24 hours after tMCAO within each group; $p < 0.05 CKD versus SHAM mice 24 hours after tMCAO, $$p < 0.01 CKD versus SHAM mice 24 hours after tMCAO.

