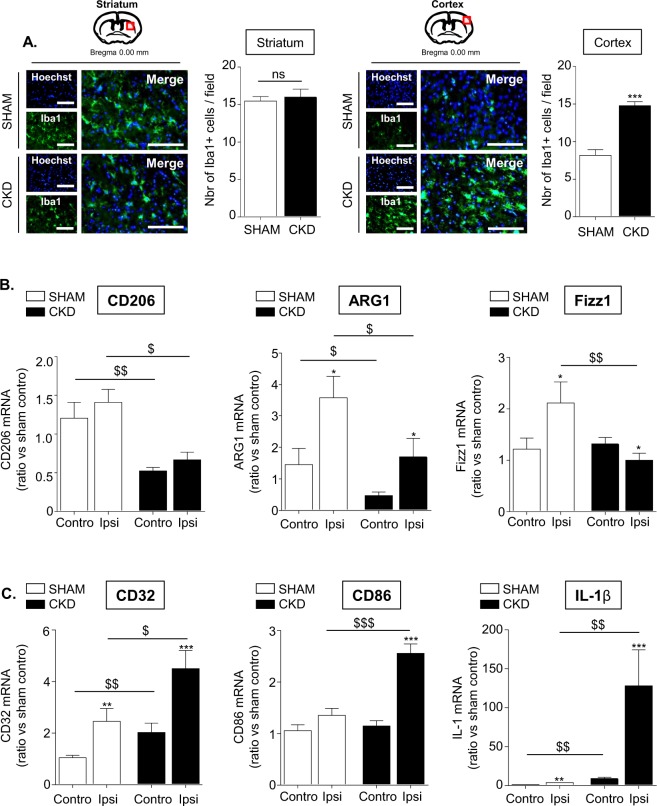
Figure 4.
CKD promotes the recruitment of microglia/macrophages within the ischemic penumbra, impairs their M2- and promotes their M1-polarization. (A) Immunostaining analysis of Iba-1 expression (a marker of activated microglia) in the striatum (left) and the cortex (right) of SHAM vs CKD mice. Bars: 100 µm. Quantifications represent the number of Iba-1 positive cells per fields of 10000 µm2. Results are expressed as mean ± SEM and represent data from at least 8 animals per group. ***p < 0.001 CKD versus SHAM mice (non parametric Mann-Whitney U test). (B) Analysis by real-time PCR of the M2 markers CD206, ARG1 and Fizz1. (C) Analysis by real-time PCR of the M1 markers CD32, CD86 and IL-1β. Results are expressed as mean ± SEM and represent data from at least 8 animals per group. *p < 0.05, **p < 0.01, ***p < 0.001 ipsilateral versus contralateral hemisphere (non parametric Wilcoxon matched pairs test). $p < 0.05, $$p < 0.01, $$$p < 0.001 CKD versus SHAM mice (non parametric Mann-Whitney U test). Contro: contralateral hemisphere; Ipsi: ipsilateral hemisphere.

