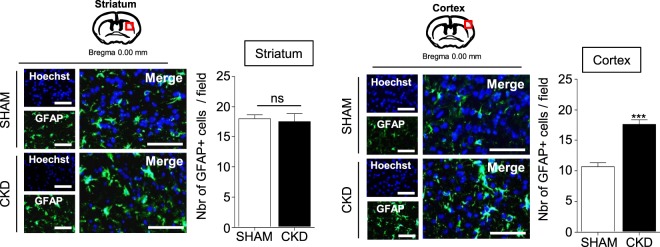
Figure 6.
CKD amplifies the astrogliosis within the ischemic penumbra. Immunostaining analysis of GFAP expression (a marker of astrocytes) in the cortex (left) and the striatum (right) of SHAM vs CKD mice. Bars: 100 µm. Quantifications represent the number of GFAP positive cells per fields of 10000 µm2. Results are expressed as mean ± SEM and represent data from at least 8 animals per group. ***p < 0.001 CKD versus SHAM mice (non parametric Mann-Whitney U test).

