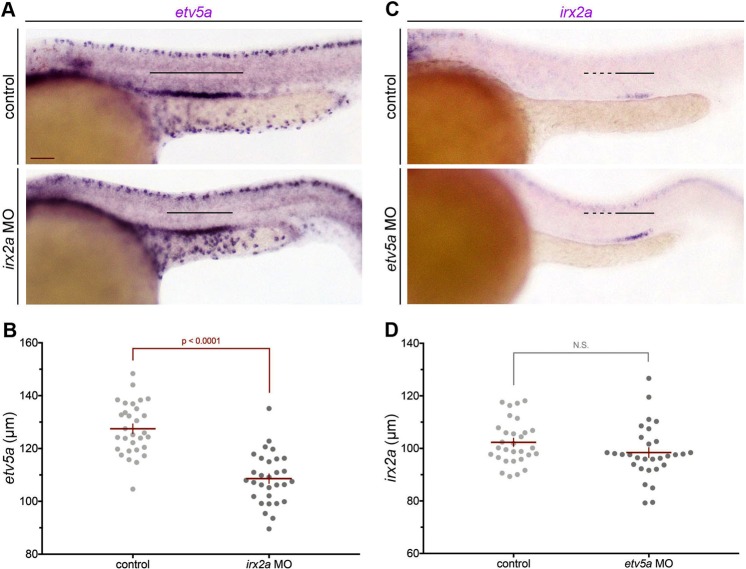
Figure 3.
irx2a acts upstream of etv5a. WISH at the 28 ss revealed decreased etv5a expression in the pronephros of irx2a morphants. Black bars denote the etv5a expression domain. Scale bar is 50 μm. (B) Quantification of etv5a length in μm at the 28 ss. Each dot represents one nephron and data is presented +/− SEM. Significance was evaluated with an unpaired student’s T-test. (C) The irx2a domain is unchanged in etv5a morphants at the 28 ss. Solid black bars denote strong irx2a expression and the dashed black lines denote faint expression in the pronephros. (D) Quantification of irx2a length (μm) at the 28 ss. Each dot represents one nephron and data is presented +/− SEM. An unpaired student’s T-test was used to determine significance. WISH – whole mount in situ hybridization, ss – somite stage.

