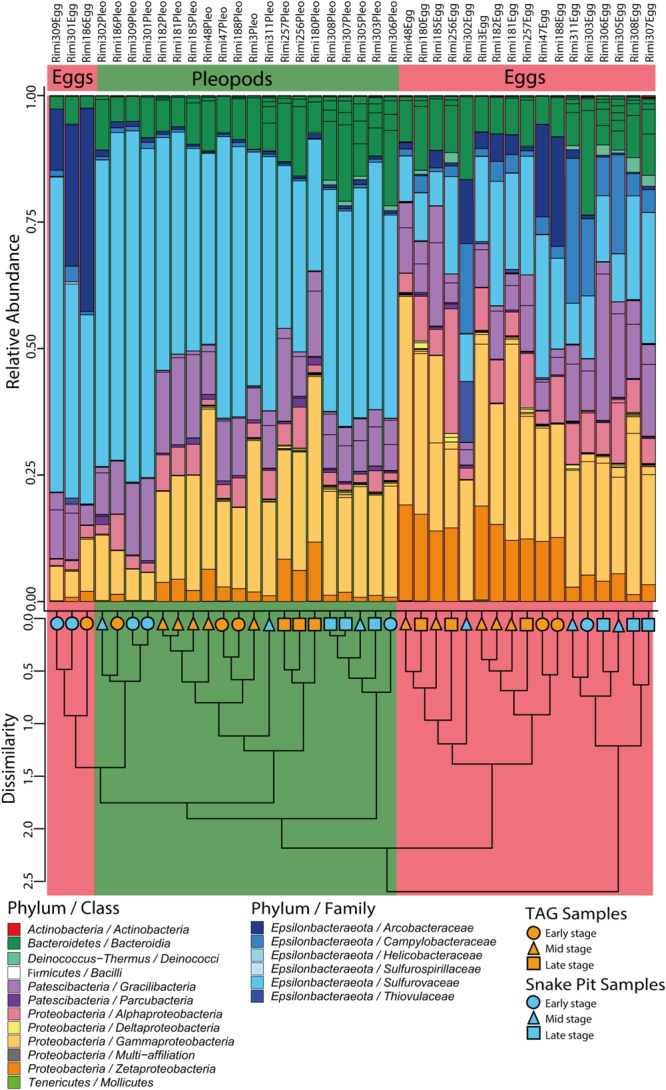
FIGURE 3.

Relative abundances of 16S rRNA gene sequence reads from egg and pleopod samples according to their classification (Silva 132 database). Groups are at the family level for the Epsilonbacteraeota phylum and at the class level for other phyla. The cluster dendrogram depicts the average linkage hierarchical clustering based on a Bray-Curtis dissimilarity matrix of community compositions resolved down to OTU level.
