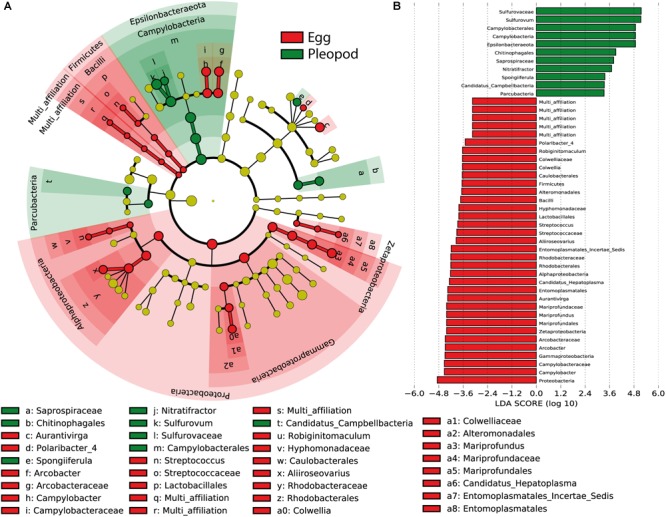
FIGURE 4.

Most differentially abundant bacterial taxa between eggs (red) and pleopods (green). (A) Cladogram representing taxonomic distribution of the differentially abundant bacterial taxa. The dots represent the specific bacterial taxa, with colors corresponding to the surface (eggs or pleopods) where these are relatively more abundant, yellow-greenish color denoting taxa with no significant difference in relative abundance between eggs and pleopods. The size of dots is proportional to the relative abundance. (B) Ranked LDA scores of the differentially abundant bacterial taxa, with taxa with highest relative abundance in pleopods in green, and taxa with highest relative abundance in eggs in red.
