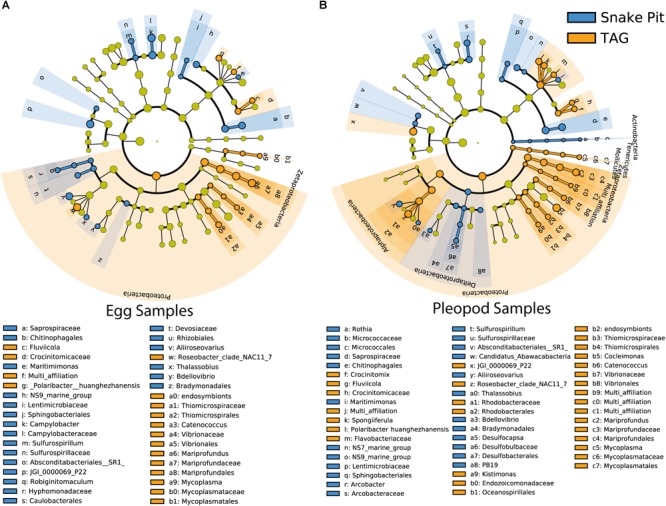
FIGURE 5.

Most differentially abundant taxa of egg communities (A) and pleopod communities (B) between TAG (orange) and Snake Pit (blue) vent fields. The dots represent the specific bacterial taxa, with colors corresponding to the vent field where these are relatively more abundant, yellow-greenish color denoting taxa with no significant difference in relative abundance between vent fields. The size of dots is proportional to the relative abundance.
