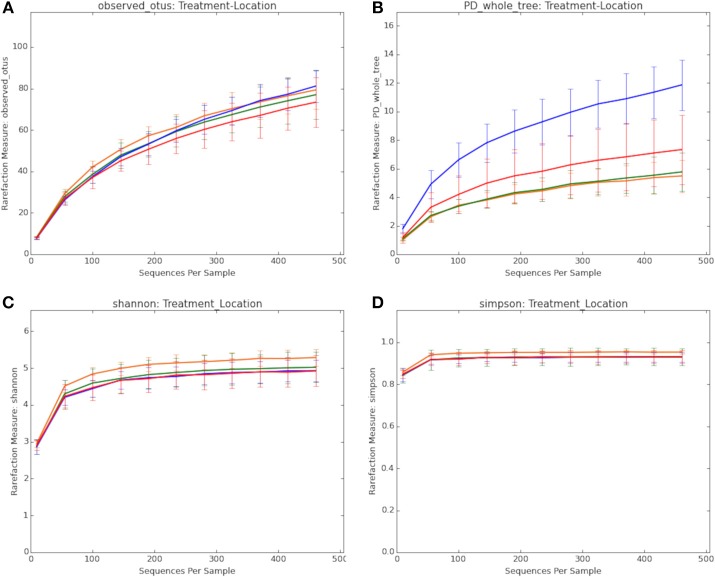
Figure 1.
Comparison of the composition of the microbiota in treatment groups. (A) Observed OTUs. (B) Faith's phylogenetic diversity. (C) Shannon alpha diversity index. (D) Simpson alpha diversity index. Treatment groups include: BMD treated, cecum (red line); BMD treated, distal colon (blue line); Control, cecum (orange line); Control, distal colon (green line).

