Figure 3.

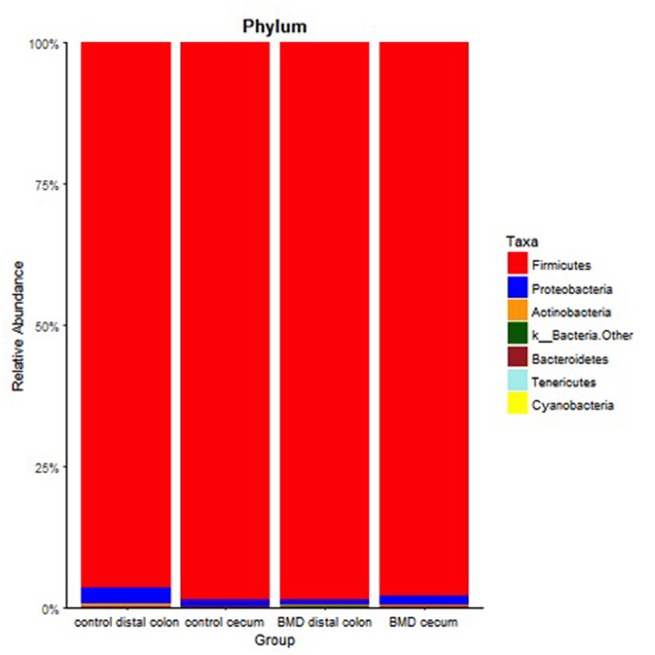
Relative abundance at the phylum level for each of the treatment groups. Specific phyla are shown in the key on the right.

Relative abundance at the phylum level for each of the treatment groups. Specific phyla are shown in the key on the right.