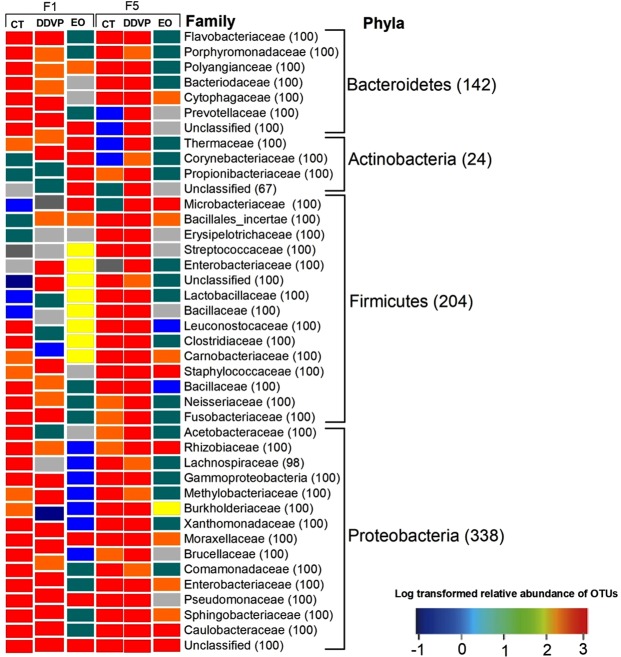
Figure 6.
Gut bacterial community composition of Callosobruchus maculatus as affected by DDVP and EO. The heat map represents the log-transformed relative abundance of each bacterial family from each sample and the blue colors represent the absence of OTUs. Only high quality trimmed sequences were used to generate the heat map. The non-abundant OTUs (<1%) are not represented in this chart. The distance of log-transformed clusters from the three samples and bacterial families are indicated in the right side of the figure. The numbers between parentheses in front of each taxon represent their relative abundance. DDVP: O,O-dimethyl,O-2,2-dichlorovinylphosphate; EO: essential oil; CT: control.

