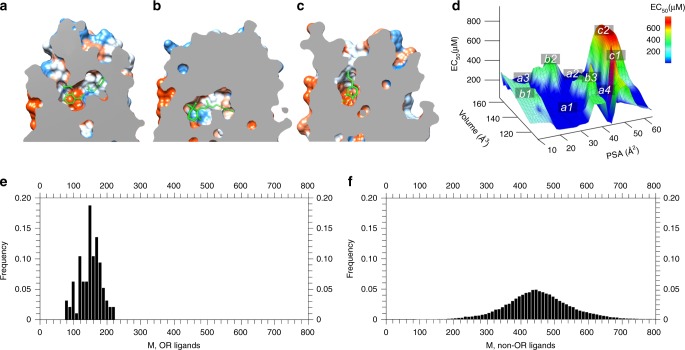
Fig. 5.
Cross-section through several GPCRs along the membrane normal showing the vertical part of the ligand-binding pocket of (a) A2AR in complex with ZMA, (b) rhodopsin in complex with retinal, and (c) Olfr73 in complex with isobutylphenol. d Plot of EC50 values versus agonist volumes and agonist polar surface areas (PSA) for Olfr73 based on all reported agonists. Highly potent agonists are located in regions a1, a2, a3 and a4; agonists with medium potency are in the regions of b1, b2 and b3; agonists with lower potency are found in regions c1 and c2. e Molecular mass distribution of OR ligands. f Molecular mass distribution of non-olfactory GPCR ligands

