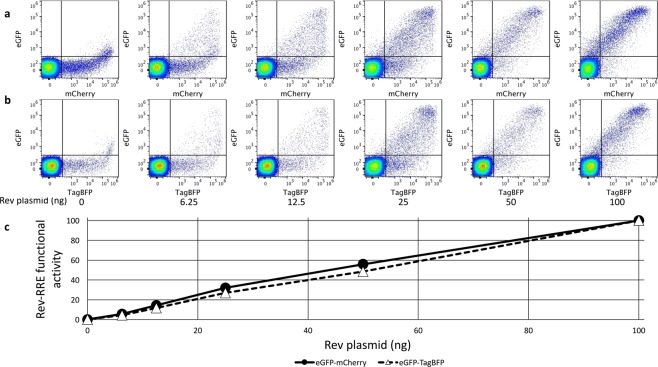
Figure 3.
Response of the two color reporter vector to increasing amounts of Rev plasmid. 1000 ng of an eGFP-mCherry (a) or eGFP-TagBFP (b) HIV-derived construct was transfected into 8 × 10⁵ 293T/17 cells along with a variable amount of CMV-Rev plasmid. Single cells were plotted with Rev-dependent eGFP signal coming from the unspliced mRNA along the y-axis and the Rev-independent signal coming from the fully spliced mRNA along the x-axis (mCherry in a and TagBFP in b). The amount of Rev plasmid transfected along with the two-color construct is listed below each plot. The proportion of the total cells in each plot is shown for every quadrant. Each plot represents at least 100,000 cells (range 107,549 to 119,937 cells). (c) For each construct, the ratio of Rev-dependent (eGFP) to Rev-independent (mCherry or TagBFP) signal MFI was calculated for each experimental condition as a measure of Rev-RRE functional activity (see gating strategy in Fig. 2 panel c). The activity in the 100 ng condition for each construct was set as 100. N = 2, vertical error bars represent SEM, which are too small to be seen in this figure.

