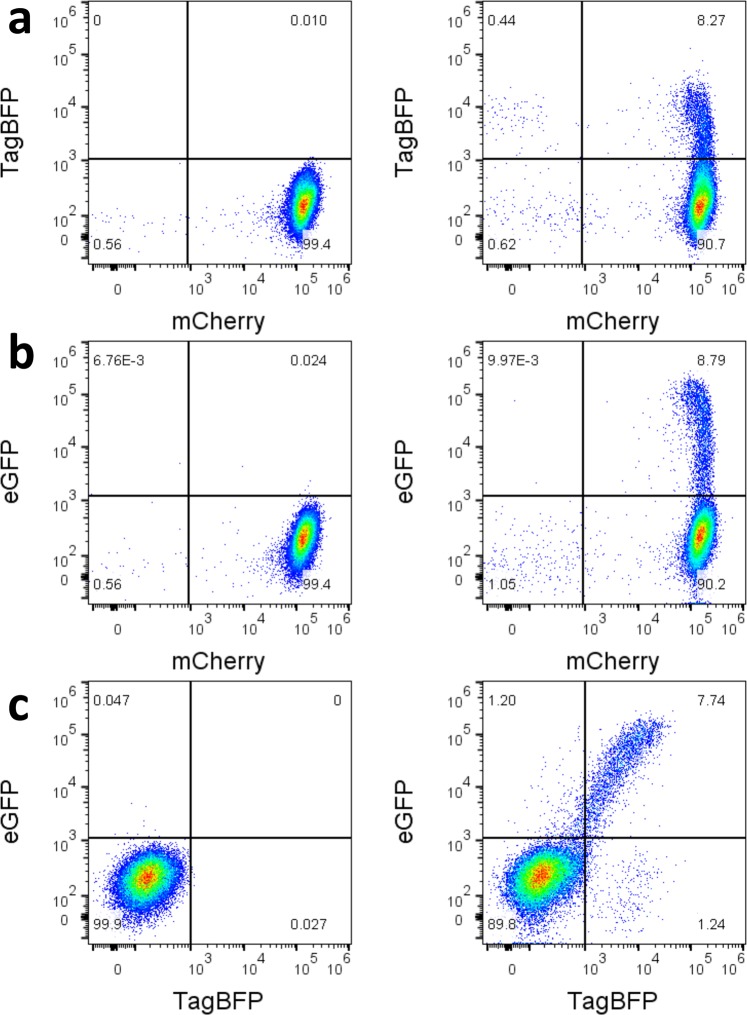
Figure 8.
Induction of eGFP expression from a CEM-SS cell line containing a stably integrated single copy of the reporter plasmid. CEM-SS cells were transduced with an eGFP-mCherry HIV-derived construct and a clonal cell line was created by limiting dilution. Thus, almost all cells show a uniformity of mCherry expression (Plot a-left). The cell line was subsequently transduced by a pMSCV-Rev-IRES-TagBFP and fluorescence was measured for all three markers. Untransduced cells are shown on the left, cells transduced with the MSCV-derived Rev/BFP expressing vector are shown on the right. Plot a (right) shows that transduction caused about 8.27% of the cells to express TagBFP. Plot b (right) shows that transduction caused about 8.79% of the cells to express eGFP. Plot c (right) shows that there is a linear relationship between the BFP and eGFP signal, indicating a strong correlation between Rev levels in a cell (BFP) and expression of the unspliced mRNA isoform (eGFP).

