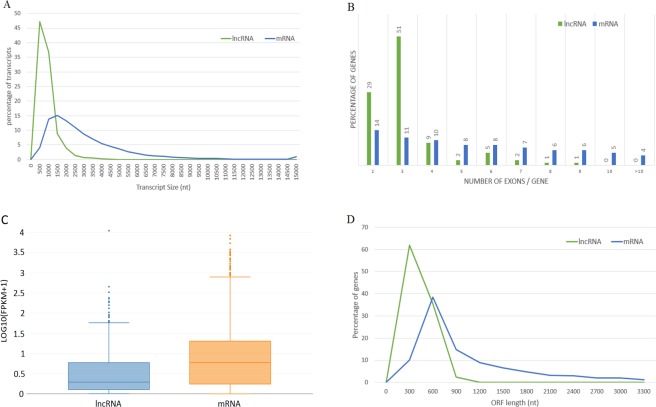
Figure 4.
Comparison of expression and genomic features of predicted lncRNA and mRNA in Pashmina goat. The lncRNA and mRNA identified in this study are utilized to identify few primary differences between two classes. (A) Distribution of transcript length of long non-coding and coding transcripts in Pashmina goat skin. The X-axis/horizontal axis represents the length of transcripts and Y-axis/vertical axis represents percentage of genes. LncRNAs were shorter in length than mRNAs with 0.7 kb and 3 kb average length of each transcript, respectively. (B) Distribution of number of exons present in mRNA and lncRNA, most of lncRNA (80%) have 2 or 3 exons whereas mRNAs tend to have two or more exons. Due to the limitation of algorithms single-exon lncRNAs were filtered out from the goat genome. (C) Expression levels indicated by LOG10(FPKM + 1) in the mRNA and lncRNAs. (D) Represents distribution of ORF in mRNA and lncRNAs. LncRNAs have shorter ORF in length than mRNAs with a mean of 100 bp and 400 bp, for lncRNAs and mRNAs, respectively.

