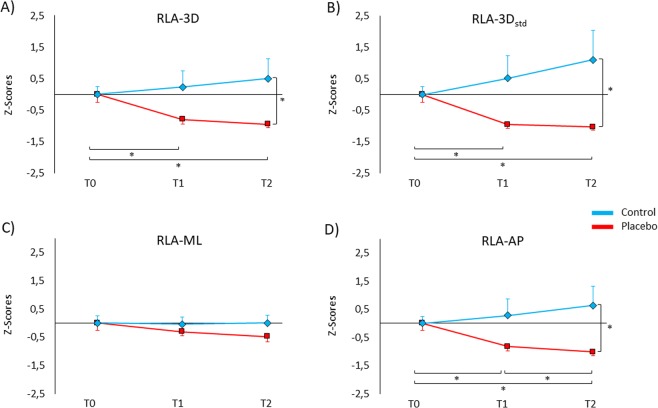
Figure 2.
Z-scores of the behavioural data for the relative leg angle (RLA). Positive values represent more postural sways, negative values represent less postural sways. (A) RLA-3D (in the three-dimensional space) was lower in the placebo group (red line) compared to the control group (blue line) at T2. Moreover, participants of the placebo group showed lower postural sways at T1 and T2 compared to T0. (B) Similarly, RLA-3Dstd was lower in the placebo group compared to the control group at T2. Additionally, RLA-3Dstd was lower at T1 and T2 compared to T0 in the placebo group. (C) RLA-ML (in the medial-lateral direction) showed no significant differences between groups and across sessions. (D) RLA-AP (in the anterior-posterior direction) was lower in the placebo group than the control group at T2. In the placebo group, RLA-AP was lower at T2 compared to T1 and T0, and at T1 compared to T0. Values are expressed as z-scores ± SE. *p < 0.050.

