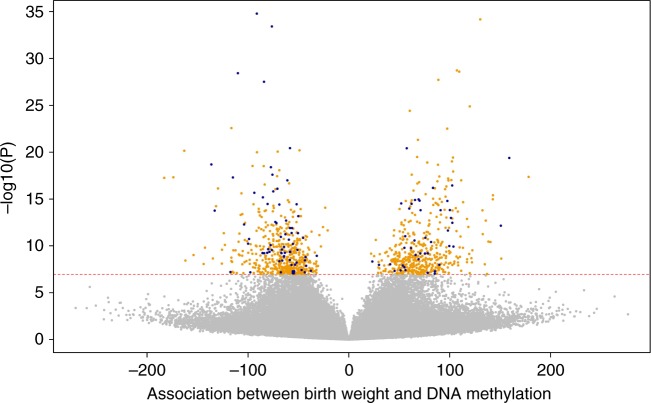
Fig. 3.
Volcano plot showing the direction of associations of DNA methylation with birthweight in 8825 neonates from 24 studies. The X-axis represents the difference in birthweight in grams per 10% methylation difference, the Y-axis represents the −log10(P). The red line shows the Bonferroni-corrected significance threshold for multiple testing (p < 1.06 × 10⁻⁷). Highlighted in orange are the 914 CpGs with p < 1.06 × 10⁻⁷ and I2 ≤ 50% and highlighted in blue are the 115 CpGs with p < 1.06 × 10⁻⁷ and I2 > 50%

