
Fig. 3.
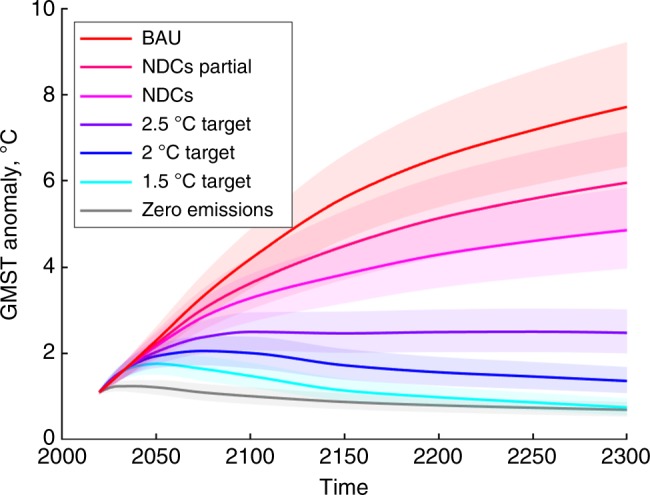
Global mean temperature simulations under the range of climate scenarios considered. Median GMST projections relative to pre-industrial 1850–1900 levels (thick lines) and the relevant 25–75% ranges (shaded areas) obtained from 100,000 runs of PAGE-ICE for all the climate scenarios considered, assuming the following legacy values of the PCF and SAF: zero permafrost emissions, constant SAF of 0.35 ± 0.05 W m−2 K−1. This serves as a base estimate for the subsequent analysis of the nonlinear PCF and SAF. Source data are provided as a Source Data file