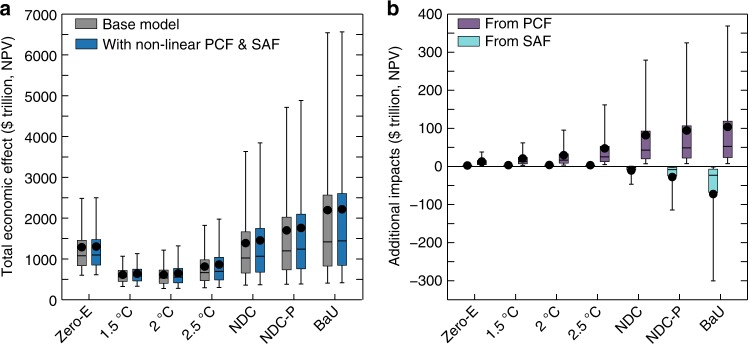
Fig. 5.
Total economic effect of climate change with the nonlinear and legacy Arctic feedbacks. a NPVs of the total economic effect of climate change (until 2300, equity-weighted, PTP-discounted), plotted for the legacy Arctic feedbacks (Base model) and with the nonlinear PCF & SAF corrections included, and b NPVs of the additional economic impact separately from the nonlinear PCF and SAF, calculated relative to their legacy values under the climate scenarios considered. Whiskers: 5–95% range; boxes: 25–75% range; horizontal lines: median; dots: mean. 100,000 Monte-Carlo runs of PAGE-ICE. The effect of the imaginary Zero Emissions scenario is higher compared to the 1.5 °C, 2 °C and 2.5 °C scenarios due to the large mitigation costs. Source data are provided as a Source Data file

