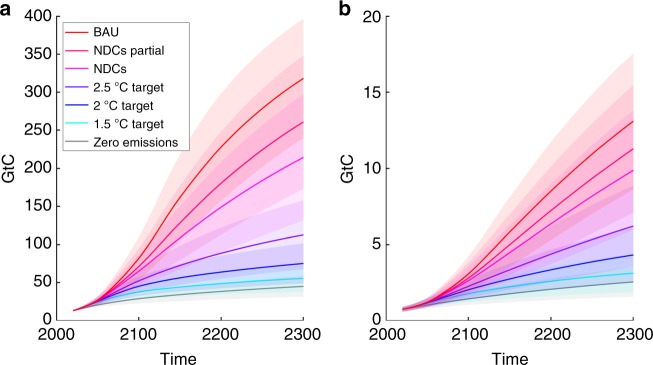
Fig. 7.
Cumulative carbon emissions from the permafrost simulated using the dynamic emulator. Cumulative carbon emissions from thawing land permafrost for a CO2 and b methane components simulated by the new statistical emulator of SiBCASA and JULES (equal weighting) under the chosen range of climate scenarios until the year 2300 (solid lines: mean; shaded areas: ±1SD). 100,000 Monte-Carlo runs of PAGE-ICE. Units: GtC. Note the difference in the Y-axis scale between the plots. Source data are provided as a Source Data file

