
Fig. 8.
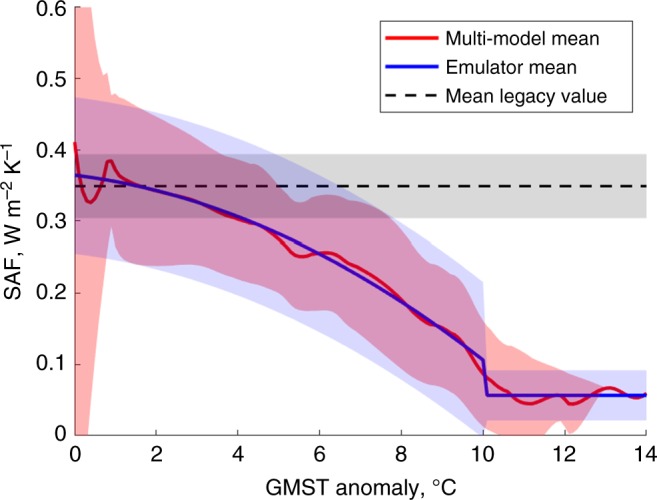
Emulator of the global surface albedo feedback and its legacy value. Global SAF as a function of the GMST rise relative to pre-industrial conditions obtained from 16 CMIP5 GCMs using the ALL/CLR method. Red line: multi-model mean; shaded red area: ±1SD; blue line and shaded area: mean and ±1SD of the two-segment emulator. The dashed line and grey shaded area show statistical mean and ±1SD of the SAF averaged between pre-industrial conditions and the level of warming corresponding to the 2xCO2 ECS experiment (mean value of 2.8 °C, 5–95% range of 1.7 °C–4.2 °C according to IPCC AR5). Source data are provided as a Source Data file