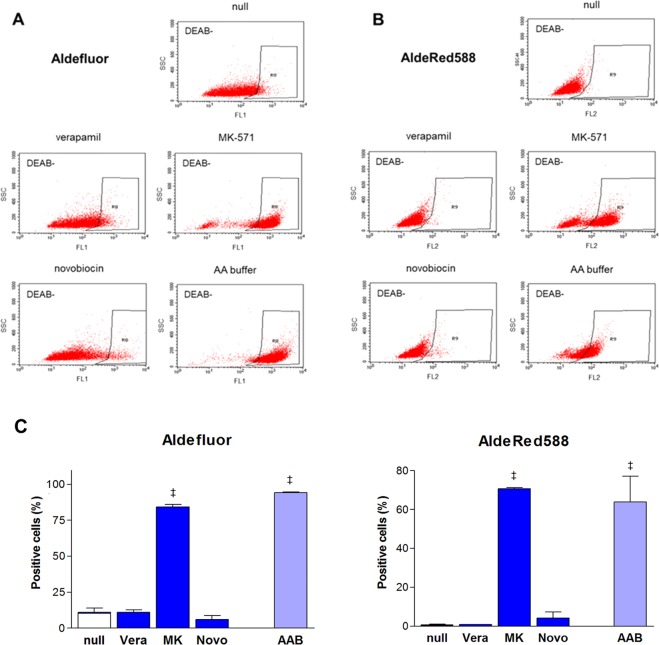
Figure 4.
ABC transporter inhibitors affect Aldelfluor or AldeRed588 efflux from HT29 cells. FACS (representative of 4–6 samples per group) of Aldefluor (A) and AldeRed588. (B) ALDH assays of HT29 cells in the presence of MDR1 inhibitor (verapamil; Vera, 20 μM), MRP inhibitor (MK571; MK, 50 μM), and BCRP inhibitor (novobiocin; Novo, 200 μM) compared to their absence (null; top). DEAB was not used. ALDH assays of CT26 cells performed in Aldefluor assay buffer (AA buffer) compared to PBS with 2% FBS (null). ALDH-positive cells within black boxes are identified by low side scatter and high fluorescence. (C) Proportions of ALDH positive HT29 cells based on FACS analysis using Aldelfluor (top) and AldeRed588 fluorescence (bottom). Effects of ABC transporter inhibitors and use of Aldefluor assay buffer (AAB) are compared. Bars are mean ± SE of % relative to controls obtained from 2 or 3 independent experiments for 4–6 samples per group. ‡P < 0.001, compared to vehicle treated controls.

