Fig. 1.
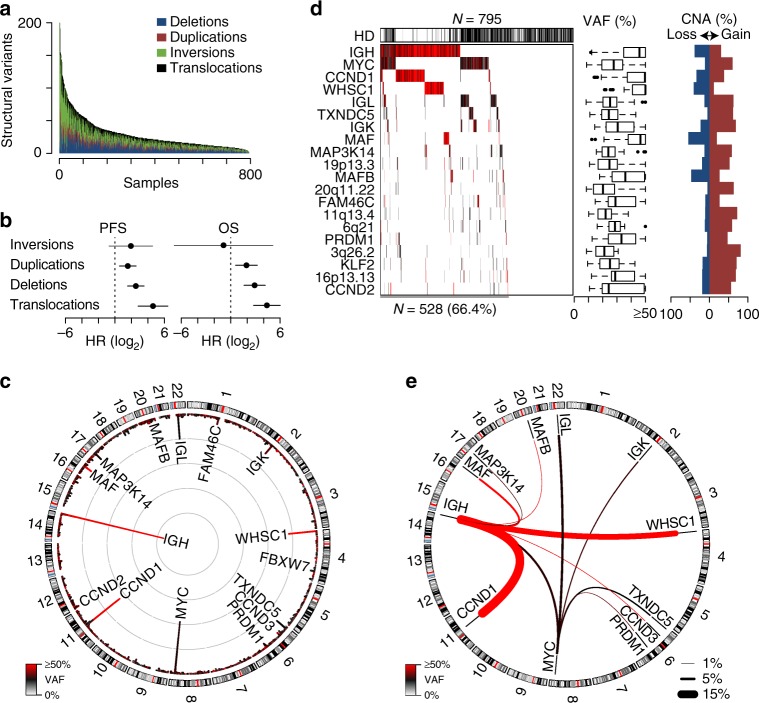
Structural variants correspond with poor prognosis. a The number of somatic structural variants per sample in 795 newly diagnosed myeloma specimens ordered by the total number of structural variants. Three samples are cropped at 200 structural variants, but have 1823, 529, and 257 SV. b Progression-free (PFS) and overall survival (OS) hazard ratios (HR) for structural variants indicating the increased hazard of having the maximum number of each structural variant, with 95% confidence intervals shown. c Circos plot of translocation frequency. The frequency of translocations is plotted on the inside with gray concentric circles denoting 10 percentiles per megabase and the color of each region represents the median variant allele frequency (VAF; key bottom left). Chromosome ideograms are represented and labelled on the outside. d Waterfall plot of translocated regions showing those present in ≥2% of newly diagnosed patients (left). Hyperdiploid (HD) status is denoted above. The VAF of each translocation is denoted in color and summarized in boxplots (middle) showing the median and quartiles with the whiskers extending to the most extreme data point within 1.5 times the interquartile range. The frequency of proximal (≤10 kb) copy number alterations (CNA) associated with each translocation are shown (right). e Circos plot of translocated regions prevalent in ≥1% of samples. The thickness and color of lines connecting two regions denotes the frequency and median VAF of the translocation, respectively (see keys bottom right and left). Hazard ratios were determined using a Cox proportional hazards regression Wald’s test as a function of the number of structural events. Source data are provided as a Source Data file

