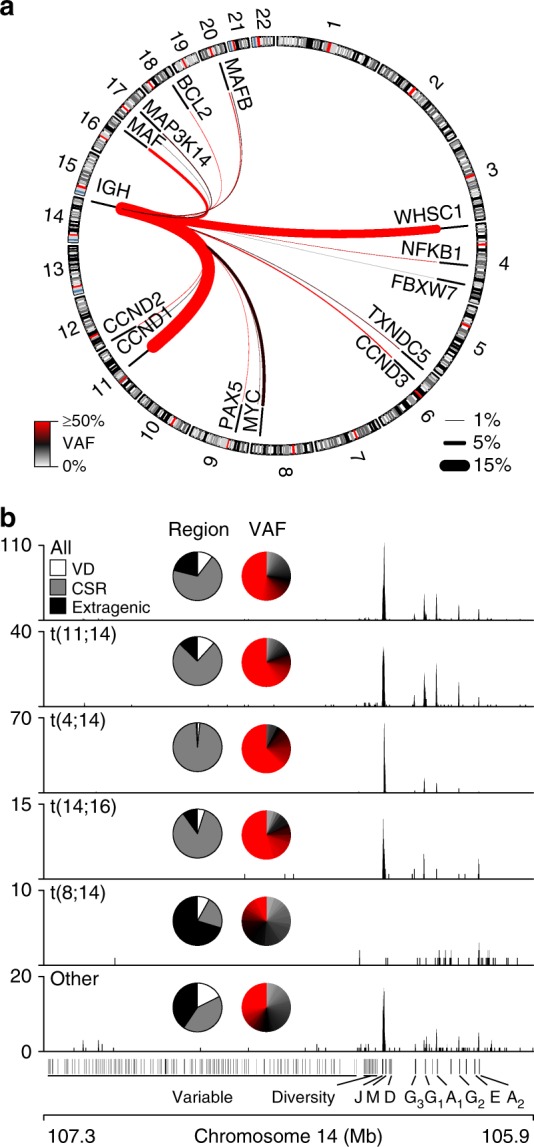
Fig. 2.

IgH translocations have distinct etiologies. a Circos plot of IgH translocations in newly diagnosed myeloma patients (N = 795). The frequency and median VAF of each type of translocation is denoted by the thickness and color of the line, respectively (key bottom left and right). b Genome (GRCh37) plots of translocations across the IgH region for all IgH translocations (top) or specific types of IgH translocations (below). Inset are pie charts depicting the percentage of translocations that occur in the variable and diversity (VD), class switch recombination (CSR) (+/−2.5 kb), and extragenic regions (left) and the VAF of each translocation. Source data are provided as a Source Data file
