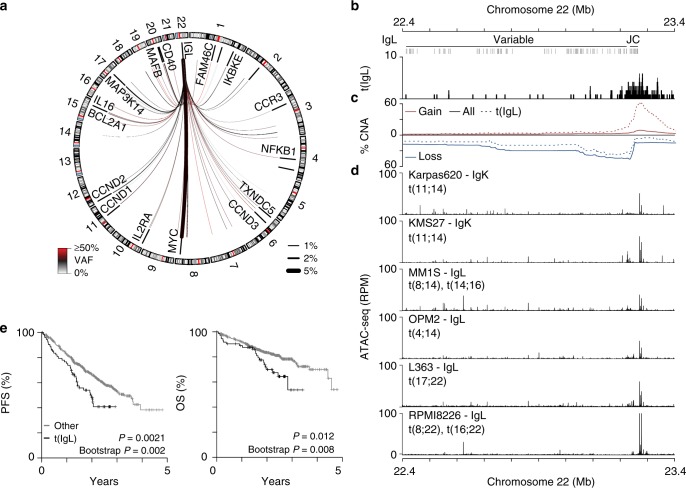
Fig. 4.
IgL translocations portend poor prognosis. a Circos plot showing the repertoire of IgL translocations in newly diagnosed myeloma where line color and thickness denote variant allele frequency (VAF) and translocation frequency (keys bottom left and right). b Genome plot (GRCh37) of the IgL locus showing the variable, joining (J), and constant (C) regions and locations of translocation breakpoints. c The frequency of copy number gains (red) and losses (blue) in the entire cohort (solid line) and in t(IgL) samples (dashed line), and d ATAC-seq for 6 myeloma cell lines labelled with their light chain expression status and known translocations denoted. e Kaplan-Meier analysis of IgL translocated [t(IgL)] patients (N = 78) as compared to non-t(IgL) (N = 717) for progression-free (PFS; left) and overall survival (OS; right). P-values were calculated using a Cox proportional hazards Wald’s test or Bootstrapped based P-value with 1000 permutations based on the hazard ratio. Source data are provided as a Source Data file

