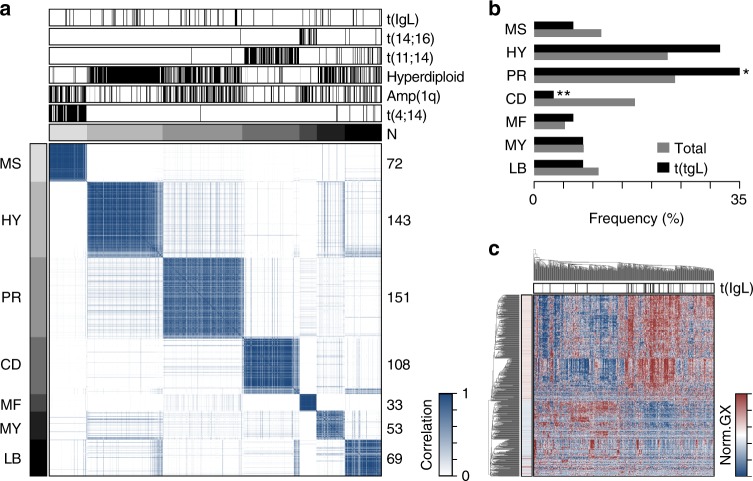
Fig. 5.
IgL translocations occur in all gene expression subtypes. a Consensus clustering of 629 newly diagnosed myelomas with whole genome sequencing and RNA-seq. Expression subtypes are denoted by gray annotation bars (top and left), and labels correspond with those defined by Zhan et al.24. The number of samples are denoted on the right. b Frequency of gene expression subtypes in all myelomas (gray) and in t(IgL) myeloma (black). c Heatmap of genes differentially expressed in t(IgL) myeloma as compared to others. Samples (columns) are clustered with t(IgL) status annotated (top; black) and gene significance denoted (left). *P < 0.05; **P < 0.01, two-sided Fisher’s exact test. Source data are provided as a Source Data file

