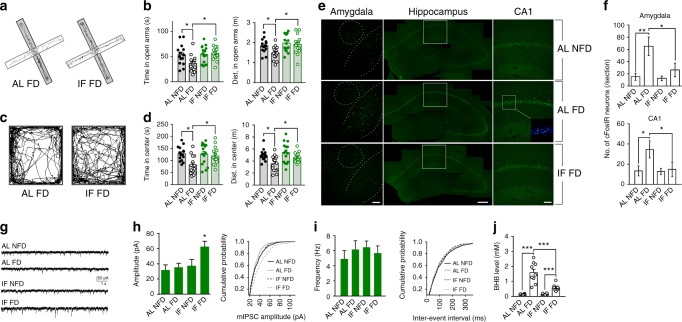
Fig. 1.
Behavioral and neuronal network adaptations to IF involve enhanced GABAergic activity. a–d WT mice were maintained on either an ad libitum diet (AL) or a on IF for 1 month. Mice in each diet group were then randomly assigned to behavioral testing in the elevated plus maze and open field after either a 24 h period of food deprivation (FD) or with no food deprivation (NFD). The images at the left show tracings of the walking paths of mice in the AL FD and IF FD groups in the elevated plus maze (a, b) and open field (c, d). The numbers of mice in each group were: AL NFD, 13; AL FD, 15; IF NFD, 12; IF FD, 15. *P < 0.05. e Examples of images of c-Fos immunoreactivity in neurons in the amygdala, hippocampus and CA1 of mice in the indicated groups. The dashed lines in the images of the amygdala demarcate the boundaries of the central nucleus (upper circle) and the basolateral amygdala (lower curved lines). The white frames in the images of the hippocampus demarcate the location of the images of region CA1. f Numbers of c-Fos immunoreactive (cFosIR) neurons in the amygdala and hippocampal CA1 in mice in the four indicated groups (5 mice/group). *P < 0.05, **P < 0.01. g Whole-cell recordings of miniature postsynaptic currents (mIPSCs) in CA1 neurons in hippocampal slices from mice in the four indicated groups. h Amplitudes of mIPSCs (left) and a plot of cumulative event probability as a function of mIPSC amplitude (right) in CA1 neurons of mice in the four different treatment groups (data are from 15 neurons in slices from 5 mice/group). *P < 0.05 compared to the values for each of the other three groups. i mIPSC frequency (left) and a plot of cumulative event probability as a function of mIPSC inter-event interval (right) in CA1 neurons of mice in the four different treatment groups (5 mice/group). j Serum β-hydroxybutyrate (BHB) concentrations in mice in the indicated groups. ***P < 0.001. All error bars are the SEM. All statistical comparisons used ANOVA and Newman–Keuls post hoc tests. Source data are provided in supplemental Source Data file

