
Fig. 2.
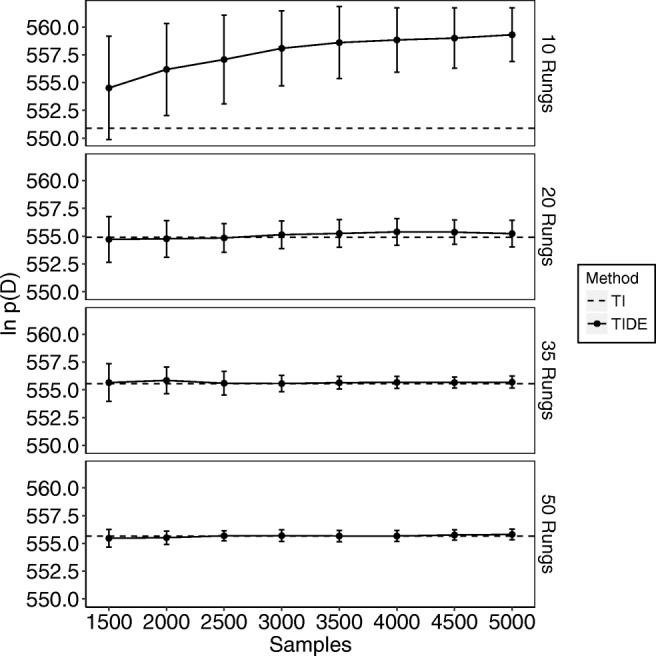
The estimated natural logarithm of the marginal likelihoods (y-axis) for the “complex” model across different numbers of samples (x-axis; note that this includes the samples discarded for burn-in) and different numbers of temperatures used (different plots: known as “rungs”). The dashed lines display the values obtained through standard TI, which used a fixed number of samples, and the solid lines display the values obtained through TIDE