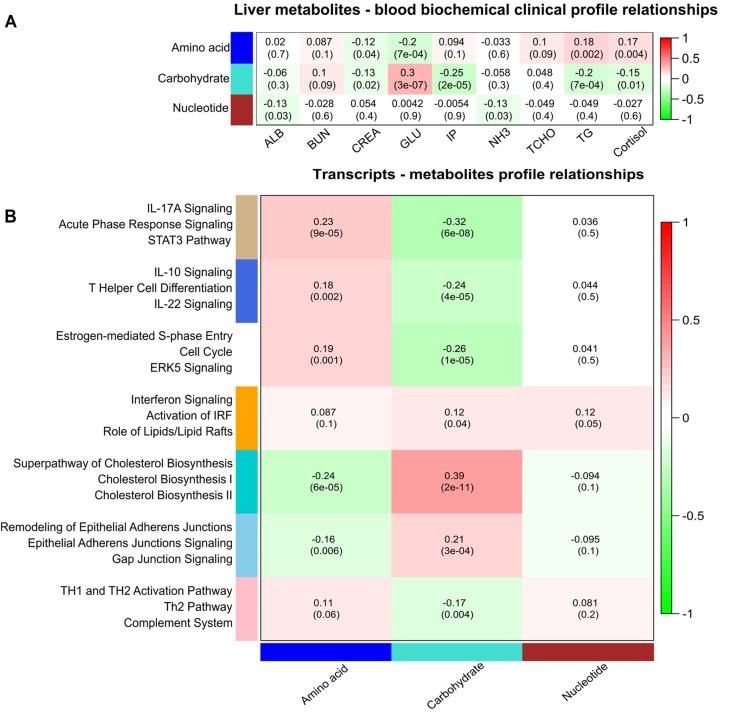
FIGURE 4.
Correlation matrix of module eigengene values obtained for metabolites, transcripts, and plasma biomarkers. Weighted gene co-expression network analysis (WGCNA) groups metabolites and transcripts into modules based on correlated abundances. Each of the modules was labeled with a unique color as an identifier. (A) Three modules of metabolites including amino acids, carbohydrates, and nucleotides showing significant correlation with plasma biomarkers. (B) Seven modules of co-expressed transcripts showing significant correlation with three modules of metabolites. Within each cell, upper values are correlation coefficients and lower values are the corresponding p-values. Canonical pathways related to genes of these seven modules of co-expressed genes are given at the left side.

