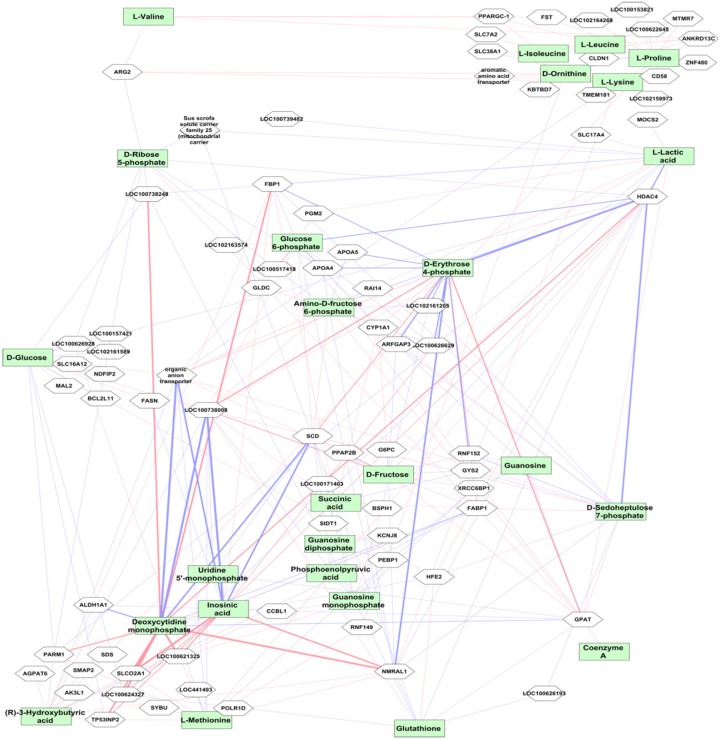
FIGURE 5.
Correlation between mRNA transcript level and metabolites. The top metabolites with strong correlation to transcripts (r > ± 0.5, p < 10-16) are shown. The red connections indicate positive correlation and blue color shows negative correlation. The level of correlation is demonstrated by the thickness of the line. The metabolites are shown in green boxes and genes are in white boxes.

