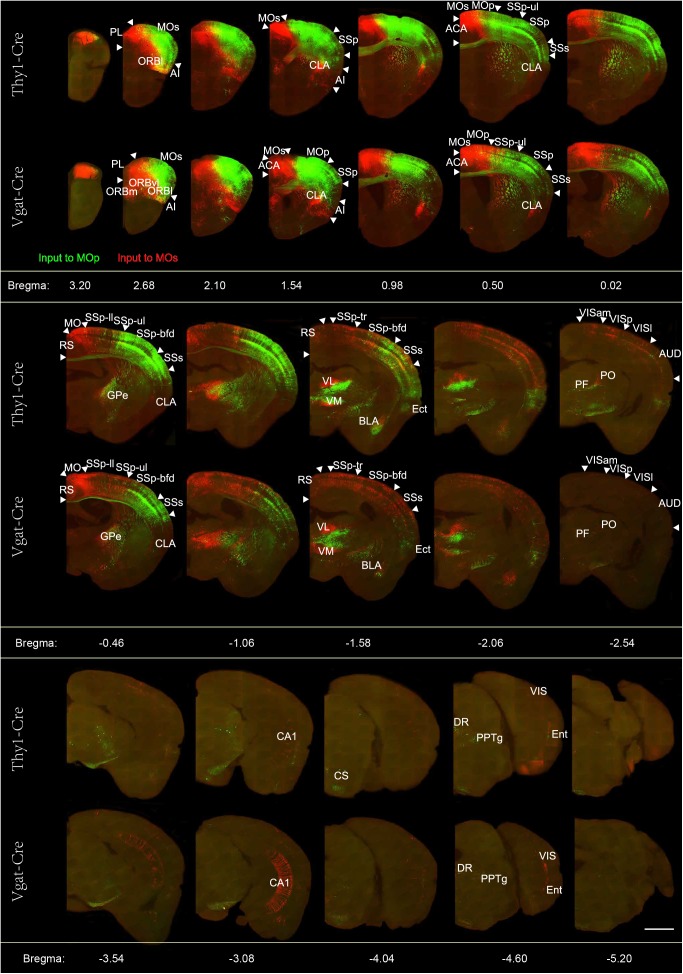
FIGURE 2.
Representative images of selected regions with monosynaptic inputs to the glutamatergic and GABAergic neurons in the motor cortex. Continuous coronal view of maximum intensity projection of the Z stack (50 μm) across the entire brain. RV-labeled neurons identified by the green signal show the neurons projecting to the Mop, while the red signal indicates the neurons projecting to the MOs. Scale bar = 1 mm.

