Fig. 2.
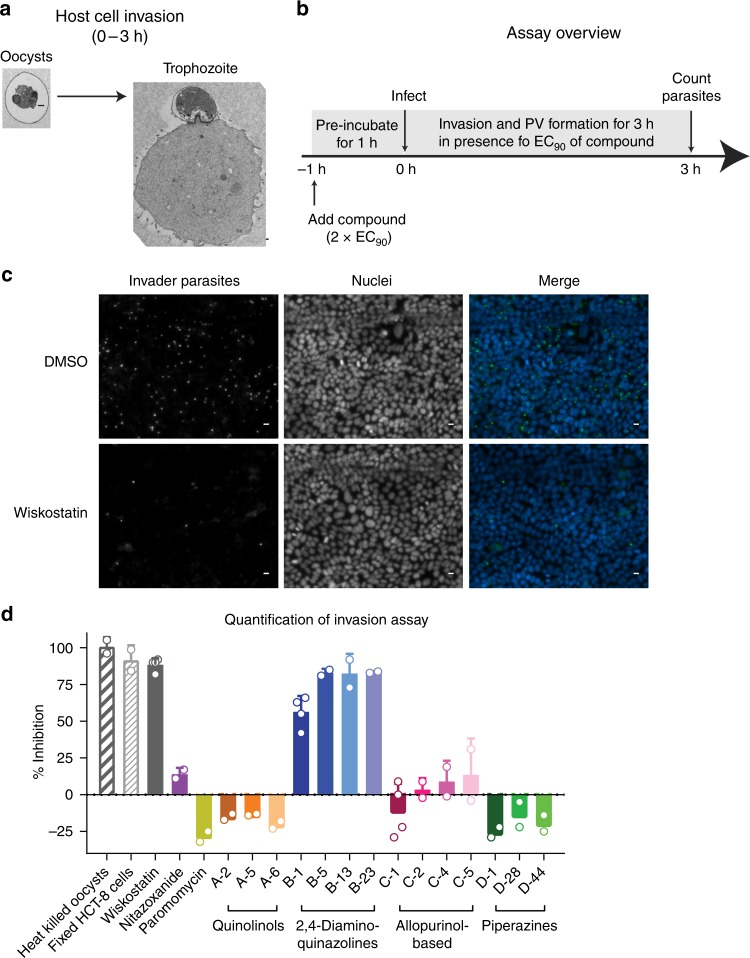
Invasion Assay. a Overview of life cycle stage investigated during the invasion assay. Representative TEM images of a C. parvum oocyst and HCT-8 cell shortly after infection (Scale bar = 500 nm). b Schematic of experimental design. Confluent HCT-8 monolayers were treated with 2 × EC90 of compounds for 1 h followed by infection with oocysts. Oocysts induced to excyst were incubated on HCT-8 cell monolayers for 3 h in the presence of EC90 of compounds, after which cells were washed, fixed, and parasite vacuoles were stained with a fluorescein-Vicia villosa lectin conjugate. c Representative images of parasite vacuoles (i.e., invaded parasites (green)) and host cell nuclei (blue) after treatment with DMSO control or EC90 (11.34 µM) of wiskostatin. Scale = 10 µm. d Quantified results for selected controls and compounds. The 2,4-diaminoquinazoline series (parent B-1 (MMV006169)) from the MMV Malaria Box inhibited invasion. Each point represents the mean and SD of at least two biological replicates with four technical replicates per experiment. Source data are provided as a Source Data file

