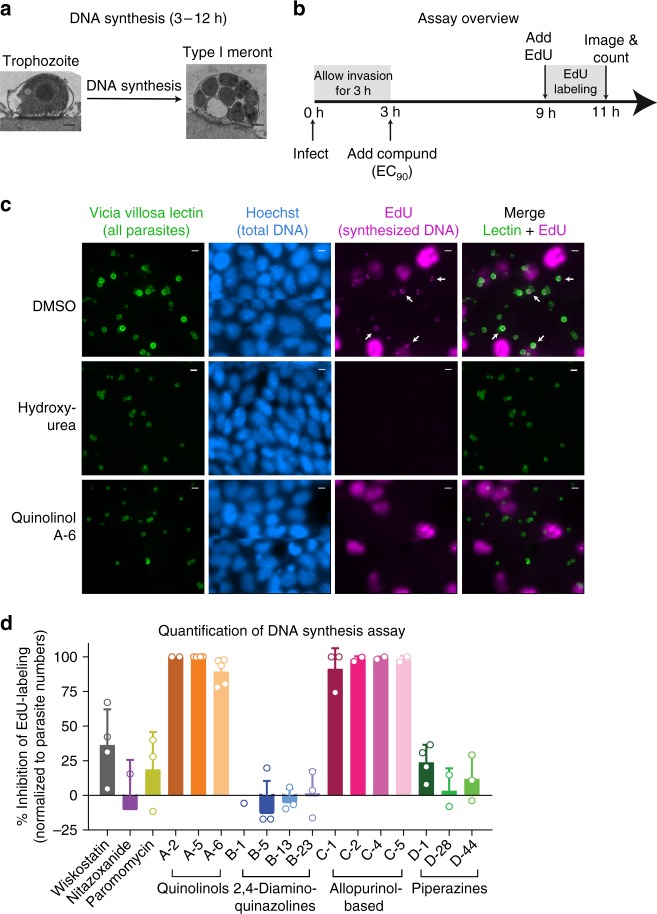
Fig. 3.
DNA Replication Assay. a TEM images of C. parvum infected HCT-8 cells demonstrating parasite morphology at the time point that the DNA replication assay is performed (Scale = 500 nm). b Overview of the experimental method. Confluent HCT-8 cell monolayers in glass bottom plates were infected with C. parvum, and compounds were added at EC90 following invasion. At 9 h post-infection, 10 µM EdU was added, followed by incubation for another 2 h, and then washing, fixing, and staining for microscopy. Note that images were acquired by focusing on parasite vacuoles, which typically reside in a different focal plane from the host cell nuclei. c Representative images of parasitophorous vacuoles (green), nuclei (blue) and EdU-labeling (magenta) after treatment with DMSO, EC90 of quinolinol A-6 (MMV000760) (1.33 µM), or 10 mM hydroxyurea. 40 × dry objective (NA = 0.7); scale = 5 µm. Arrows indicate selected parasites with EdU-labeled DNA. d Quantification of EdU incorporation. The compounds in the quinolinol and allopurinol-based series (denoted a and c, respectively) inhibited EdU incorporation. Data are mean and SD of 2–5 biological replicates. Source data are provided as a Source Data file

