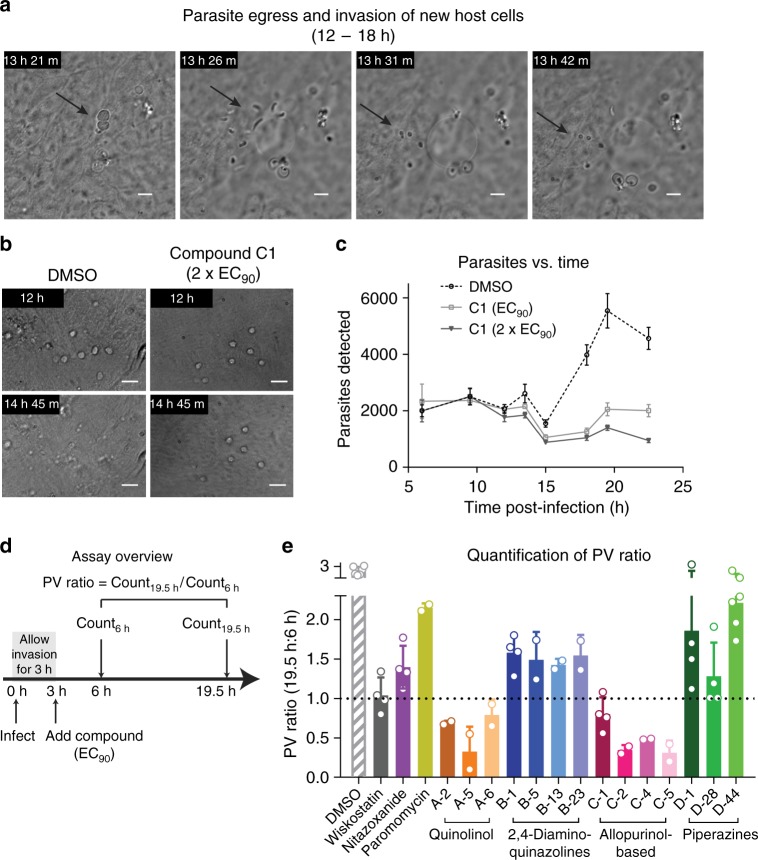
Fig. 4.
Assay to measure parasitophorous vacuole (PV) egress and invasion of new host cells. a Time-lapse microscopy showing the rapid events of PV egress to release motile merozoites that invade neighboring HCT-8 cells. 60 × oil objective (NA = 1.4); scale = 5 µm. b Time-lapse microscopy of C. parvum PVs in the presence of allopurinol-based compound C-1 (MMV403679) at 2 × EC90 (1.3 µM) or the matched DMSO control. 40 × dry objective (NA = 0.7); scale = 10 µm. c Time course infection experiment in the presence of DMSO or the allopurinol-based compound C-1 at EC90 or 2 × EC90. The graph shows PV numbers versus time for each condition. Data points are mean and SD, n = 4, representative of three independent experiments. d Outline of the experimental method for improved assay throughput. Infected HCT-8 cells were treated with EC90 of compounds 3 h after infection and PV numbers were determined at 6 h (i.e., before egress), and at 19.5 h (i.e., after egress) by immunofluorescence microscopy and an ImageJ macro. The PV ratio (count19.5 h/count6 h) is used as the assay readout. e Graph showing PV ratios for selected controls and the test set of compounds. All compounds reduced the PV ratio compared to DMSO, but to varying degrees and with good agreement within each chemical series. Data combined from at least two independent experiments (six for DMSO control) with four technical replicates each, mean and SD shown. Source data are provided as a Source Data file

