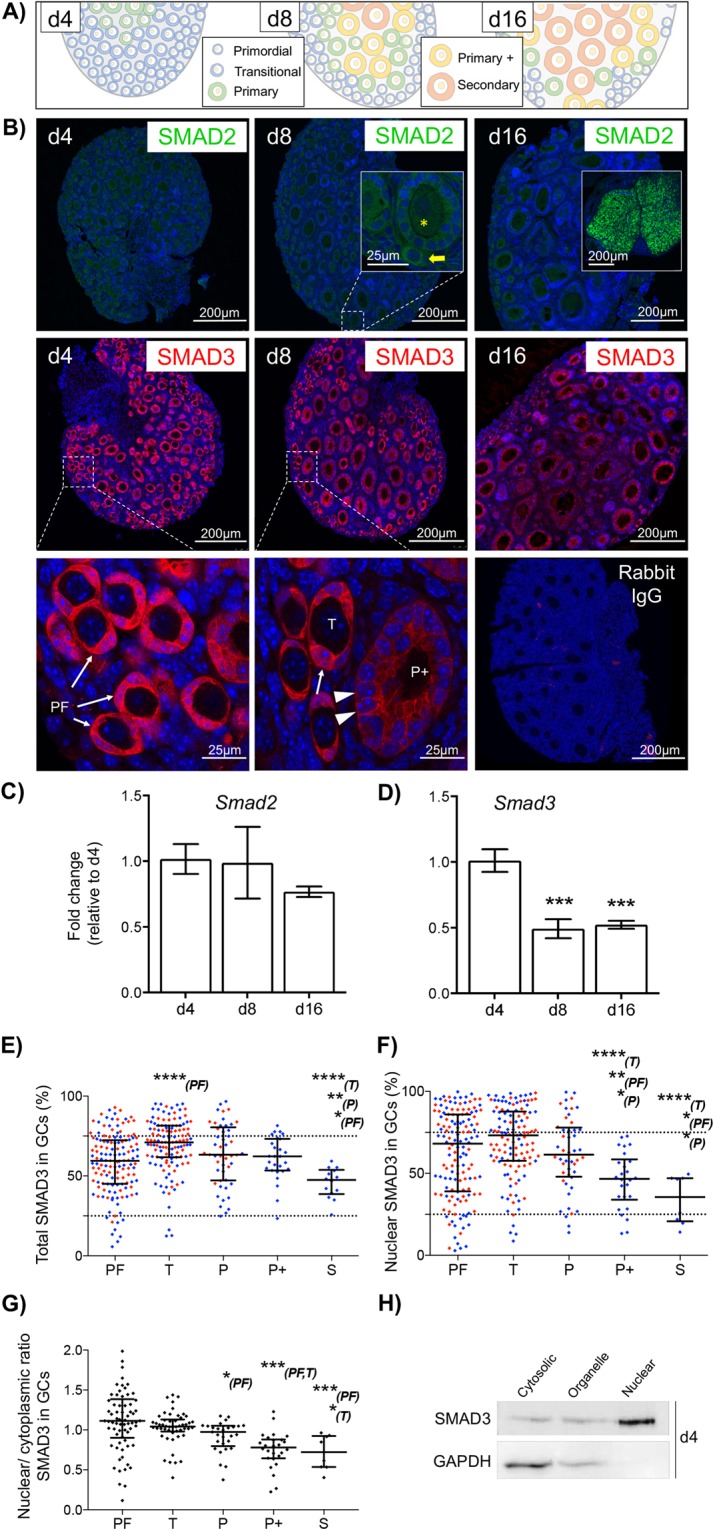
Figure 1.

SMAD3 is predominantly expressed in GCs of primordial follicles. (A) Diagram showing the follicle composition of the prepubertal mouse ovary at 4, 8 and 12 days of age (d4, d8, d12). (B) Immunofluorescent localisation of SMAD2 and SMAD3 protein in the prepubertal mouse ovary. SMAD2 (green) was weak/undetectable in prepubertal ovaries, including primordial (yellow arrow) and early growing primary follicles (yellow asterisk), but was strong in corporal lutea from adult ovary (d16 inset). SMAD3 (red) localised to the nuclei and cytoplasm of GCs of primordial and transitional follicles (arrows), with nuclear expression appearing weaker in GCs of growing primary-plus follicles (arrowheads). Cell nuclei are counterstained with DAPI (blue). Rabbit IgG is shown as a negative control. (C,D) Relative expression of Smad2 and Smad3 mRNA by qPCR in d4, d8 and d16 ovaries. (E–G) Quantitative analyses of SMAD3 immunofluorescence. (E) Data represents total SMAD3 staining intensity in GCs by follicle stage. Each point represents the % positive pixels in the GC compartment for an individual follicle. (F) Nuclear SMAD3 intensity in GCs by follicle stage. Each point represents the % positive pixels in individual GC nuclei within each follicle stage. Points in red and blue represent measurements from d4 and d8 ovaries, respectively. (G) Nuclear/cytoplasmic ratio of SMAD3 in GCs by follicle stage. Each point represents the % positive pixels in all GC nuclei relative to % positive pixels in the GC compartment for an individual follicle obtained from d8 ovaries. Dashed lines (E,F) demarcate lower and upper quartiles to represent proportions of samples that were considered low, medium and high intensity staining, respectively. (H) Subcellular expression of SMAD3 by western blotting in protein lysates from d4 mouse ovaries. Samples were separated into cytosolic, membrane-bound organelle, and nuclear fractions. The cytoplasmic protein GAPDH is included as a control. Gel images have been cropped from originals provided in Fig. S1. PF, primordial; T, transitional; P, primary; P + , primary plus, S, secondary follicle. Data in C, D are means ± SEM (n = 5 ovaries/age) and differences are relative to d4. Data in E, F, G are medians ± interquartile ranges and differences are relative to the follicle stage in parentheses. *P < 0.05, **P < 0.01, ***P < 0.001, ****P < 0.0001.
