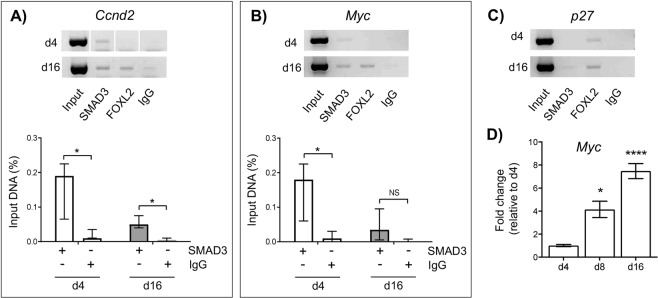
Figure 3.
SMAD3 directly regulates Ccnd2 and Myc expression in primordial follicles. (A–C) Amplification of target binding sites upstream of the Ccnd2, Myc and p27 genes following ChIP. Representative gel images showing amplification of DNA after immuno-precipitation with anti-SMAD3, anti-FOXL2 (GC expressed transcription factor – control), or non-specific antibodies (IgG) in d4 and d16 mouse ovaries. A positive sample of chromatin (Input) prior to immunoprecipitation is also shown (upper panels). Relative quantification of anti-SMAD3 IgG binding to Ccnd2 (lower panel A) and Myc (lower panel B) gene promoters in d4 and d16 ovaries by qPCR. % input was calculated by normalizing anti-SMAD3 IgG and non-specific IgG (control) against input DNA as described in the materials and methods. Each group (d4, d16) contained 5 repeats (n = 5 ovaries). Data are medians ± interquartile range and statistical differences are relative to IgG control. *P < 0.05, NS: Not significant. Note the Ccnd2 gel is a composite as indicated with divisional space and all gel images have been cropped from originals provided in Fig. S3. (D) Relative expression of Myc mRNA by qPCR in d4, d8 and d16 ovaries. Means ± SEM (n = 5 ovaries/age) and differences are relative to d4. *P < 0.05, ****P < 0.0001.

