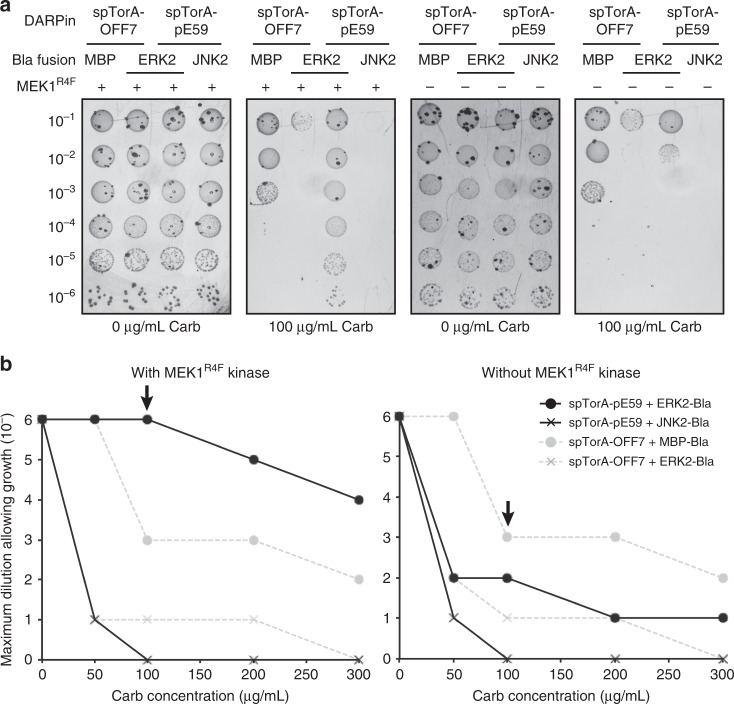
Fig. 2.
Phenotypic selection of pERK2-specific DARPin binding. a Representative spot titer images and b survival curves for serially diluted E. coli MC4100 cells co-expressing TatABC along with the antigen-Bla reporter fusion (MBP-Bla, ERK2-Bla, or JNK2-Bla) and a Tat-targeted DARPin (spTorA-pE59 or spTorA-OFF7) as indicated. Resistance of cells was evaluated in the presence (+) or absence (−) of MEK1R4F kinase. Overnight cultures were serially diluted in liquid LB and plated on LB agar supplemented with Carb. Maximal cell dilution that allowed growth is plotted versus Carb concentration. Arrow in b indicates Carb concentration that is depicted in image panel a above the graphs and corresponds to 100 μg/ml Carb. Source data for this figure is available in the Source Data File

