
Fig. 4.
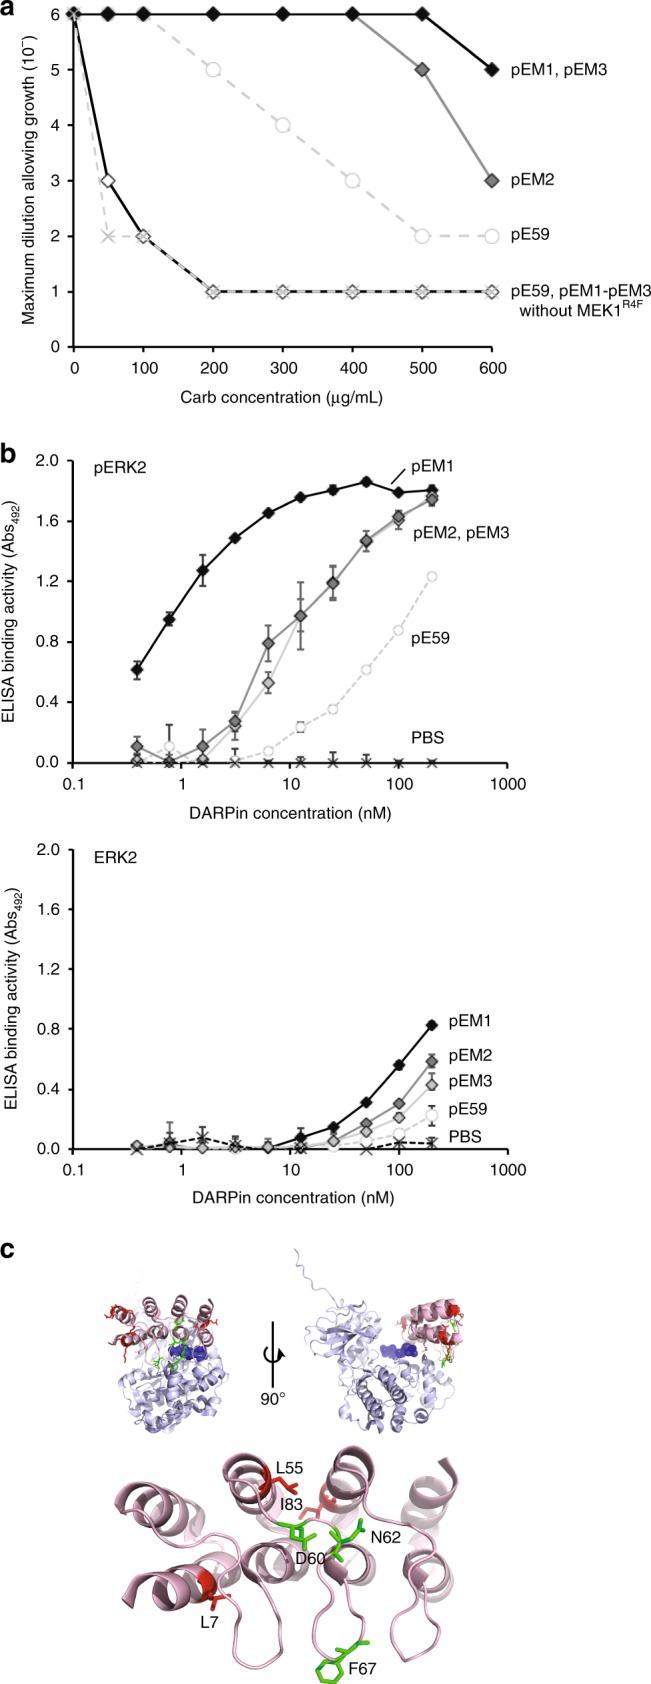
Isolation of DARPin variants with enhanced pERK2 affinity. a Survival curves for serially diluted E. coli MC4100 cells co-expressing TatABC along with ERK2-Bla and Tat-targeted DARPins pEM1 (light gray), pEM2 (dark gray), and pEM3 (black). Resistance of cells was evaluated in the presence (filled diamonds) or absence (empty diamonds) of MEK1R4F kinase. Overnight cultures were serially diluted in liquid LB and plated on LB agar supplemented with Carb. Maximal cell dilution that allowed growth is plotted versus Carb concentration. Resistance profiles for pERK2-specific DARPin pE59 are shown with (empty circles) and without (light gray x marks) MEK1R4F for comparison. b ELISA binding activity for purified DARPins pE59, pEM1, pEM2, and pEM3 against immobilized pERK2 (top) or ERK2 (bottom). PBS served as a negative control. All data are the average of three biological replicates and the error bars represent the standard deviation (SD). c Location of mutations in DARPin variants pEM1, pEM2, and pEM3 mapped onto the pE59-pERK2 co-crystal structure. The structure was derived from PDB ID 3ZUV described in Kummer et al.30, and the schematic was generated using PyMOL software. The DARPin is shown in light red, pERK2 in light blue, the phosphorylated T185 and Y187 active site residues of ERK2 in dark blue spheres, and the mutations found in helix and loop secondary structures in red and green, respectively. Source data for this figure is available in the Source Data File