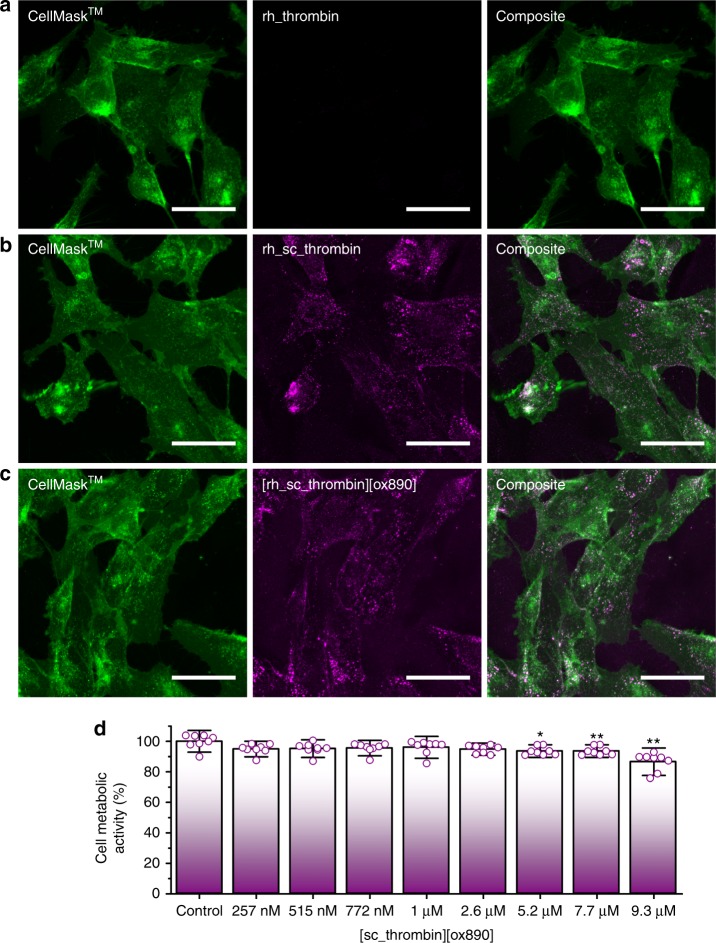
Fig. 3.
Evaluation of rh_thrombin, rh_sc_thrombin and [rh_sc_thrombin][ox890] hMSC plasma membrane affinity. Cells labelled with CellMask™ Deep Red (green) and corresponding rhodamine labelled thrombin (magenta). a Native (rh_thrombin) thrombin at T = 0 h. b Cationised (sc_rh_thrombin) thrombin at T = 0 h. c Polymer surfactant conjugate ([rh_sc_thrombin][ox890]) thrombin at T = 0 h. Scale bars represent 50 µm. d MTS cell metabolic activity assay (n = 8) of hMSCs after labelling with [sc_thrombin][ox890] compared to unlabelled controls. Data reported as means ± s.d. Dunnett’s test; *p ≤ 0.05, **p ≤ 0.001. Source data are provided as a Source Data file

