Fig. 4.

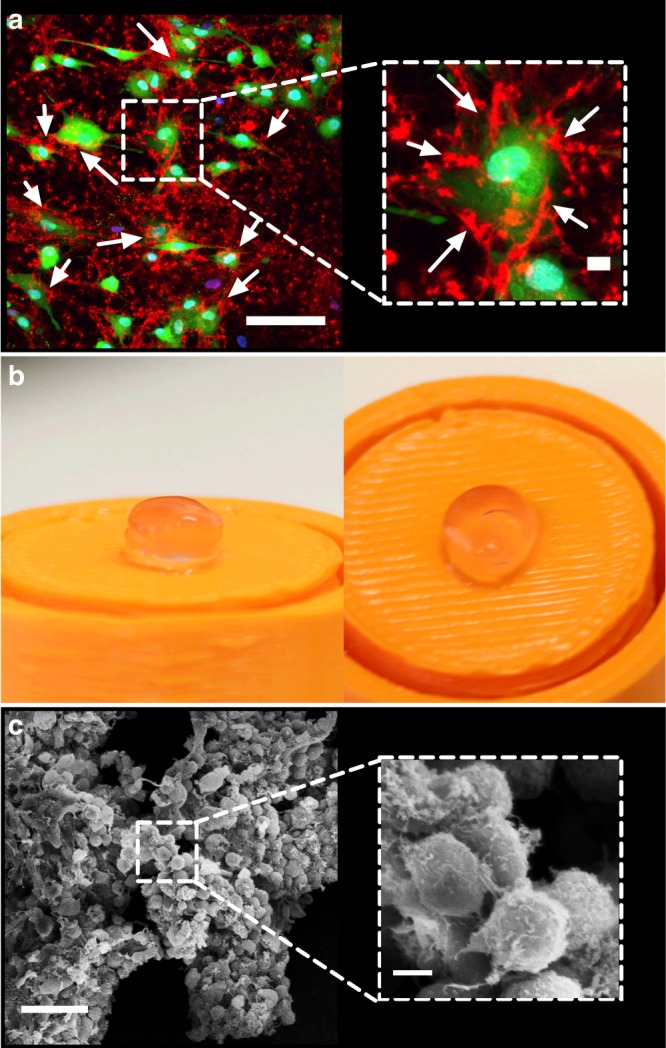
Evaluation of cellular fibrin hydrogel formation. a Live-cell confocal fluorescence micrograph (2D) showing Alexa Fluor® 594 labelled fibrin (red) nucleation after 20 min from the surface of hMSCs stained with Calcein AM (green) and Hoechst 33342 (blue). Insert shows single cell at higher magnification. Scale bars represent 100 and 10 μm (insert). b Photographs of the free-standing fibrin hydrogels 24 h after gelation formed via [sc_thrombin][ox890] hMSCs labelling. c Scanning electron micrograph of [sc_thrombin][ox890] modified hMSCs aggregates (3D) after 24 h showing a surface catalysed fibrin matrix. Insert shows cells at higher magnification. Scale bars represent 50 and 5 μm (insert)
