Fig. 5.

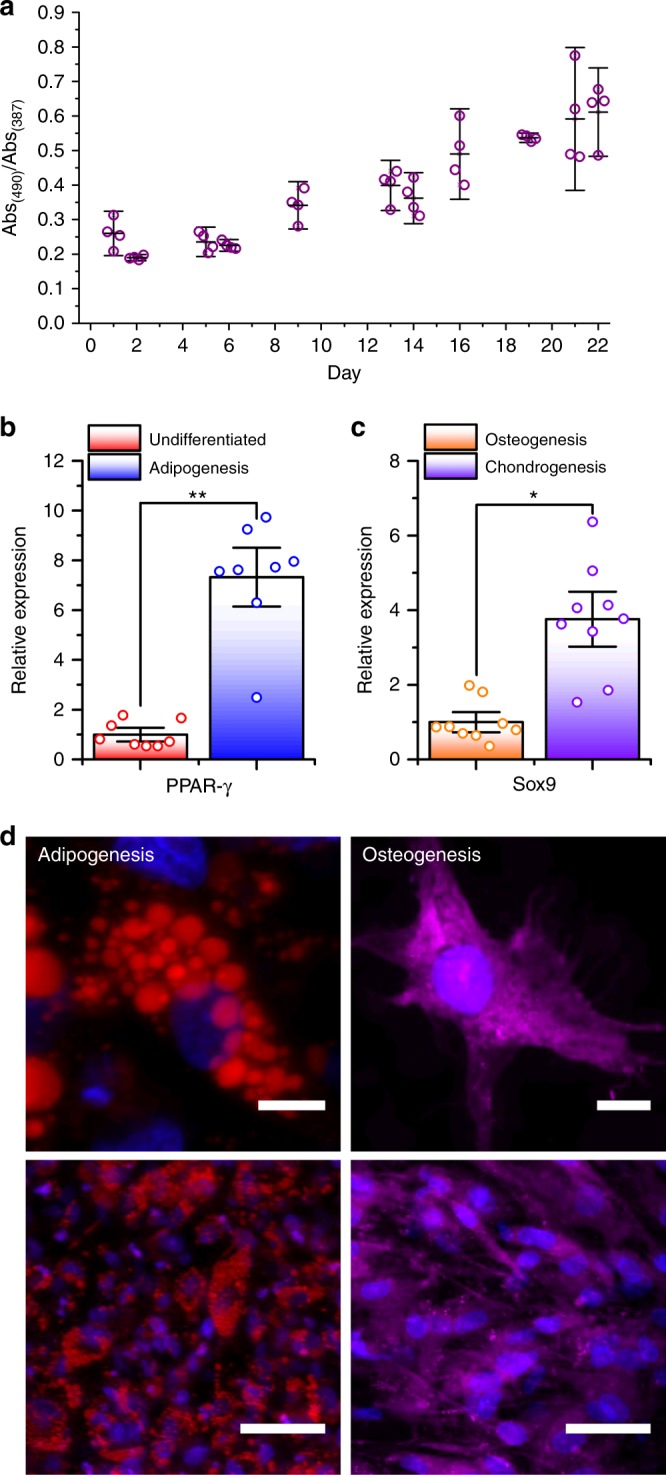
Cell metabolic activity and differentiation potential of hMSCs within in situ formed fibrin hydrogel constructs. a MTS cell metabolic activity assay (n ≥ 4) of hMSCs at various intervals after fibrin construct formation. Data reported as the mean ratio of product:reactant ± s.d. b Relative expression (n = 8) of PPAR-γ in [sc_thrombin][ox890] coated hMSCs within catalysed fibrin, cultured in standard or adipogenic medium for 14 days. Data reported as means ± standard error of the mean (s.e.m.). One-tailed paired t-test; **p ≤ 0.01. c Relative expression (n = 9) of SOX9 in [sc_thrombin][ox890] coated hMSCs within catalysed fibrin, cultured in chondrogenic or osteogenic medium for 7 days. Data reported as means ± s.e.m. One-tailed paired t-test; *p ≤ 0.05. d Confocal fluorescence micrographs (Z-projections) of individual (top) and groups of (bottom) cells within fibrin constructs with scale bars representing 10 and 50 μm, respectively. Cells stained with Hoechst 33342 (blue) differentiated down adipogenic (left) and stained with oil red o (red) and osteogenic (right) and stained with alizarin red (magenta) lineages. Source data are provided as a Source Data file
