Fig. 1.
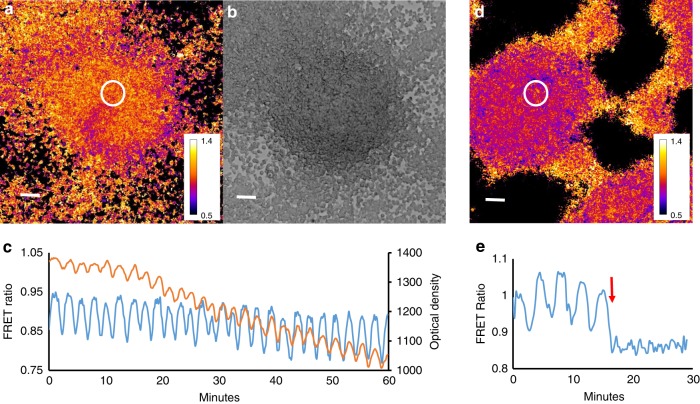
cAMP and optical density waves during late aggregation. a cAMP FRET ratio of a late aggregate. b Optical density image of the same aggregate as shown in (a). c FRET ratio and optical density changes as function of time measured in the circle region shown in a. Correlation analysis has shown that the FRET trace lags ~30 s to the optical density trace. Note the asymmetry of the FRET signal, the curves peak down which is also seen as a wide region of high FRET ratios and small band of lower FRET values (purple). d FRET image of mound on a black millipore filter. e Time trace of cAMP oscillations before and after exposure to 5 mM caffeine measured in the white circled area shown in d. FRET oscillations stop immediately after caffeine exposure at t = 15 min and there is an immediate decrease in the FRET ratio. White scale bar in images is 50 µm. The results are representative for over 30 experiments with wild-type cells and 10 experiments with caffeine performed on different days

