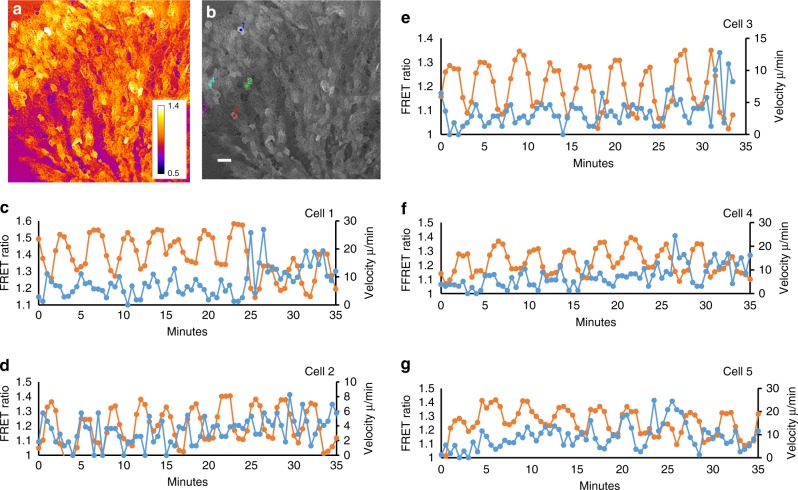
Fig. 4.
Correlation between cAMP signalling and movement of individual cells in an aggregation stream. a FRET ratio image of end of aggregation stream. b Image of stream with starting position of five cells that have been followed for around 35 min. c, d, e, f, g cAMP measurement (orange) and instantaneous rate of movement (blue) of cells 1, 2, 3, 4, 5, respectively. Lags calculated from the cross correlations between the FRET and velocity signals over the length of the tracks are −2.5, −1.5, −2.5, −2.5 and −3 min respectively for cells 1–5. This indicates that the cells maximal velocity is reached ~2.5 min before the internal cAMP concentration reaches its peak. White scale bar 50 µm. The experiments are representative for three experiments performed on different days

