Fig. 8.
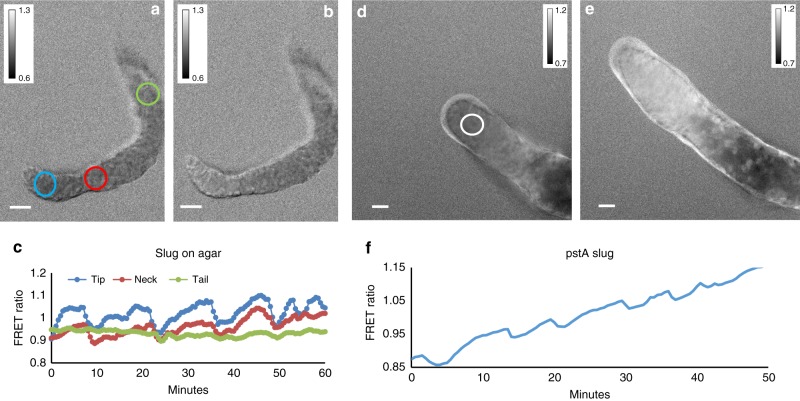
FRET ratio measurements of cAMP oscillations in slugs migrating on top of agar in silicon oil. a, b FRET ratio images of slug migrating on top of agar 6 min apart. Note the change in FRET ratio in the slug tip between these two time points. c Traces of FRET ratio in tip neck and tail of the slug a shown in a. The experiments are representative for seven experiments performed with slugs migrating on agar taken on different days. (d, e) FRET ratio images of slug expressing the Epac FRET construct under the control of the pstA promoter 25 min apart. f FRET trace measured in the tip of the slug at the position of the white circle. White scale bar 50 µm. The experiments are representative of nine experiments with pstA/Epac1 FRET slugs performed on different days

