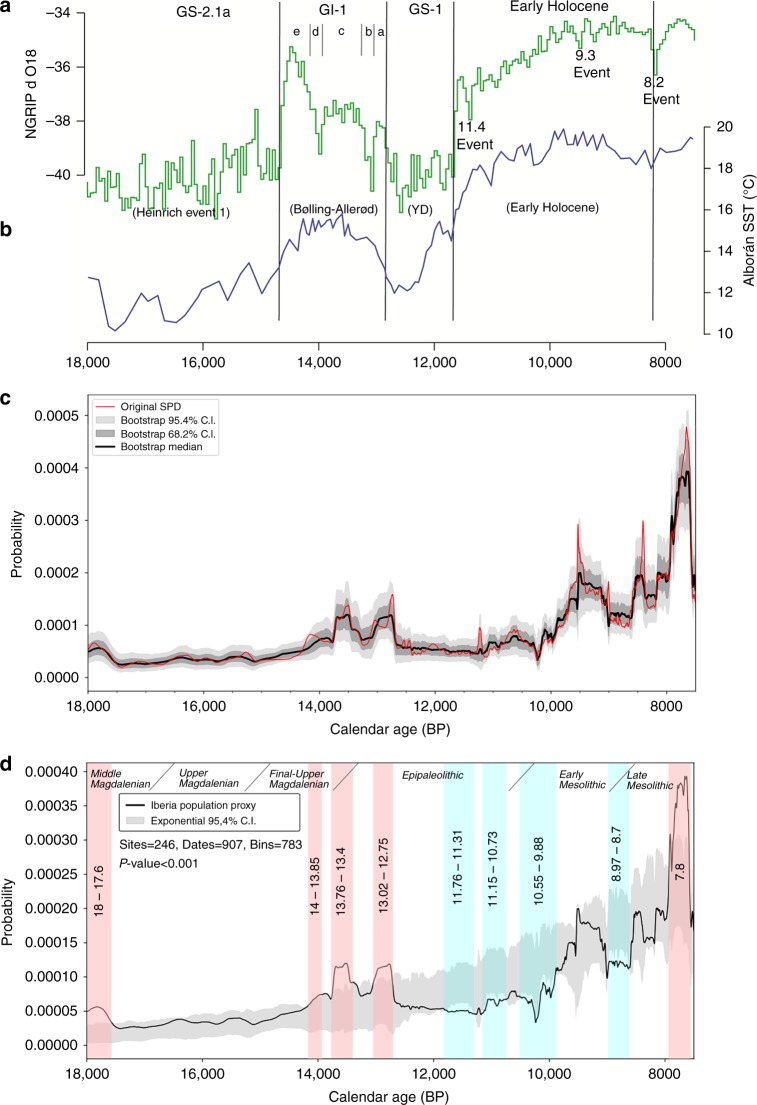
Fig. 2.
SPD inferred population density changes between 18,000 and 7500 cal BP for Iberia. a, b Palaeoclimatic framework of the Last Glacial-Interglacial transition. a The green curve represents the variation of 18O from the NGRIP ice-core record with the Greenland stratotype chronology77. b The blue line depicts the reconstruction of Sea Surface Temperature based on the deep-sea core MD95-2043 in the Alborán sea, considered as a palaeoclimatic proxy specific to the Iberian Peninsula56. c Summed Probability Distribution (SPD) of the calibrated radiocarbon dates after applying bootstrap simulations on the taphonomically corrected SPD curve (in black) (seeMethods). d Population proxy (in red) plotted against a bootstrapped null model of exponential growth. Light red and light blue shaded regions denote positive and negative deviations from the null model of exponential demographic growth respectively. The global p value is calculated using the computational method of Timpson et al.8 for a set of simulated SPDs and express the global significance of the curve's departure from the exponential null model

