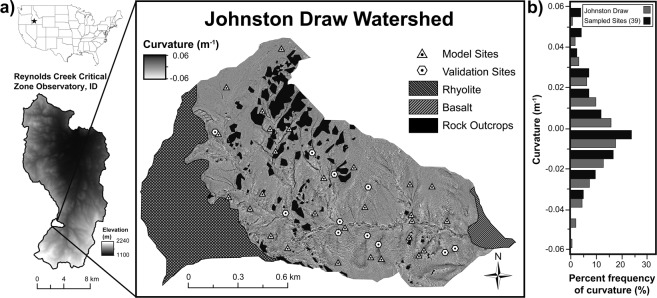
Figure 1.
Hillslope curvature across Johnston Draw catchment. (a) A hillslope curvature map of Johnston Draw, a subcatchment of Reynolds Creek Critical Zone Observatory, Idaho based on a 3 m posting of a digital elevation model (DEM) derived from a 2007 Light Detection And Ranging (LiDAR) data set (10.18122/B27C77), showing the location of the model (triangles) and validation sites (hexagons) within the soil mantled, granitic portion of the Johnston Draw catchment. (b) Curvature histograms for sampled sites (black bins) and the entire the Johnston Draw catchment (gray bins) show normal distributions centered around 0 m−1, which are planar surfaces.

