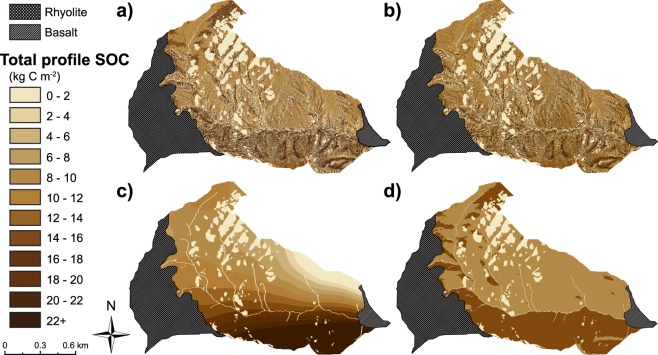
Figure 5.
Comparison of spatially distributed total soil organic carbon (SOC) stocks using SOC-curvature method compared to kriging techniques and rapid SOC method. Spatially distributed total SOC stock estimates using the (a) SOC-curvature method, (b) regression kriging, (c) kriging with barriers and (d) the new rapid SOC method ((a–d) summarized in Table 2) within the granitic portion of the Johnston Draw catchment. SOC stocks vary from low to high values (light tans to dark browns) across the catchment. Table 3 summarizes estimated total SOC stocks, percent SOC relative to the SOC-curvature method (shown in (a)), and validation indices for each method.

