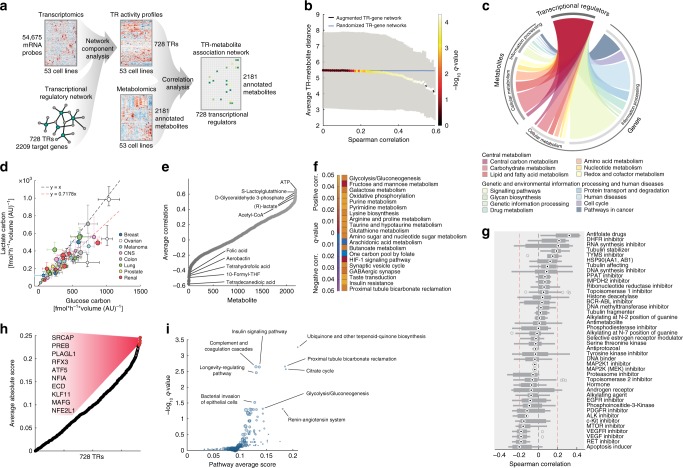
Fig. 2.
Inferring a TR-metabolite association network by integrating transcriptome and metabolome data. a Schematic overview of the computational framework for finding TR-metabolite associations. Activity of 728 human TRs was calculated using Network Component Analysis29 on expression profiles of the NCI-60 cell lines10 and the TRRUST transcriptional regulatory network24. Correlation analysis was used to find associations between TRs and metabolites. b Correlations between metabolite levels and TR activity profiles in relation to the distance between TRs and enzyme targets in the metabolic network21. The black line represents average TR-metabolite distance (y-axis) at different levels of absolute TR-metabolite correlation (x-axis). The blue line represents average TR-metabolite distance in 10.000 randomized networks. Dot color indicates significance (q-value, corrected for multiple tests) of TR-metabolite proximity compared to the randomized networks. c Distribution of TR-metabolite associations (0.1% FDR, left section) and TR-gene regulatory interactions (right section) across KEGG pathways. Edge-size connecting the TR hub and metabolic pathways reflects the number of links found in either network. d Glucose uptake vs lactate secretion. Mean ± standard deviation of rates estimated over three biological replicates and five time points. e, f Metabolites whose abundance correlated with glycolytic flux (i.e., glucose uptake and lactate secretion, e) were tested for significant (q-value, corrected for multiple tests) enrichment in KEGG metabolic pathways (f), separately for positively and negatively correlated metabolites (yellow to red and purple to blue color ranges, respectively). g Boxplot of the correlation between glucose uptake/lactate secretion and sensitivity (i.e., GI50, drug concentration causing 50% growth rate reduction) to 430 drugs31 grouped by mechanism of action. Box edges reflect 25th and 75th percentiles, center dots indicate medians, whiskers include extreme data points, and outliers are gray circles. h Association between TR activity and metabolites reporting on glycolytic flux. TR names are shown for the 10 TRs with the highest score. i For each KEGG pathway we calculated the average association score (h) among TRs with known enzyme targets in the pathway (x-axis). Significance (y-axis) is estimated using a permutation test and corrected for multiple tests (q-value). Only pathways with a q-value ≤ 0.01 are labeled

