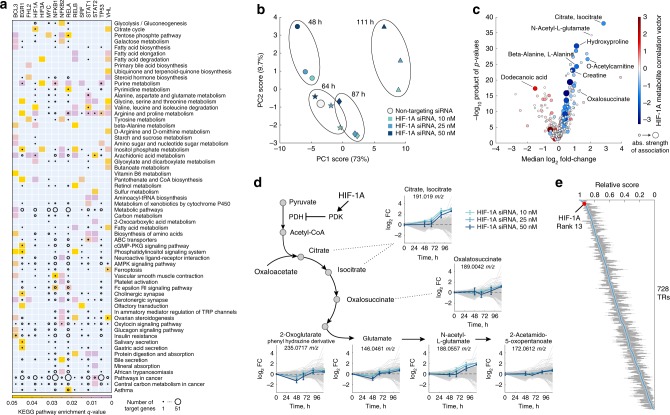
Fig. 3.
Predicted functional association of TRs to metabolic pathways. a Significant over-representation in KEGG metabolic pathways for metabolites associated with 15 selected cancer-related TRs38 (as defined by the COSMIC cancer gene census). The heatmap shows metabolic pathways with a significant enrichment (hypergeometric test, q-value < 0.05). The size of black circles scales with the number of known TR-gene targets24 in the metabolic pathway. b Principal component analysis of dynamic metabolome changes in IGROV1 ovarian cancer cells transfected with three different concentrations (10, 25, and 50 nM) of HIF-1A siRNA, and a non-targeting siRNA as negative control. c Volcano plot of metabolic changes at 111 h after HIF-1A siRNA transfection. Each putatively annotated metabolite is associated with a fold-change and significance (product of p-values across three siRNA concentrations). Only ions annotated to KEGG identifiers are shown. Dot size reports on the strength of the association predicted between HIF-1A activity and the metabolite in our TR-metabolite association network, while the color indicates the sign of the association. d Dynamic metabolite changes of metabolites in and proximal to TCA cycle upon siRNA transfection (with time-point 0 representing the negative control). Data are mean ± standard deviation across three replicates. Gray lines represent dynamic changes of all other detected metabolites. e The 728 TRs in the TR-metabolite association network were ranked by the median overlap of TR-metabolite associations with the metabolic profiles of the HIF-1A knockdown (111 h post-transfection). For each TR, we calculated a score representing the dot product of the TR-metabolite association vector and metabolite fold-changes, normalized by the sum of absolute correlations in the association network. The scores are shown as boxplots across the three siRNA concentrations (see also Supplementary Fig. 7), with blue dots indicating the median score, and edges showing 25th and 75th percentiles

