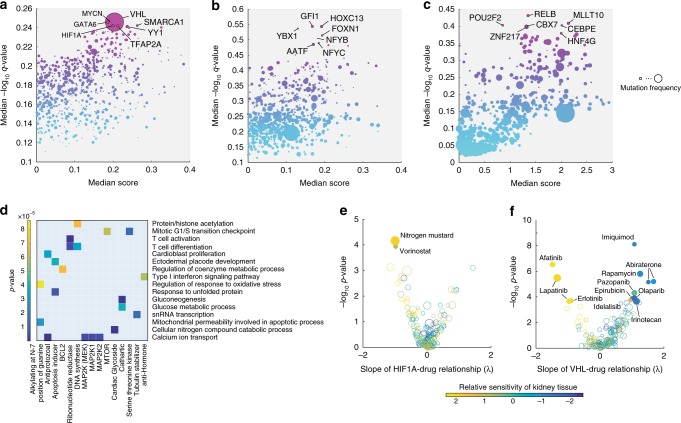
Fig. 4.
Inferring TRs as mediators of in vivo metabolic changes. a–c Prediction results in three previously published data sets comprising metabolic profiles of tumor vs. proximal healthy tissue from 21, 138, and 10 patients with clear-cell renal cell carcinoma7 (a), lung cancer43 (b), and colon cancer12 (c). Each dot represents the strength (x-axis, median score) and significance (y-axis, q-value, corrected for multiple tests, blue to purple color range) of a TR in mediating in vivo metabolic changes. Dot-size indicates the frequency of mutations in the TR-encoding gene for the respective cancer type, derived from the Catalog of Somatic Mutations In Cancer (COSMIC)38. Gene-name labels are shown for the top 1% most significant hits (see Supplementary Discussion and Supplementary Fig. 7). d 131 clusters of functionally related TRs (Supplementary Data 3) were tested against 82 different drug modes of action (MoA) to find a significant over-representation of drug-TR associations. Colored squares indicate the significance of the enrichment analysis. Only TR clusters and drug MoAs with at least one significant association (p-value < 1e−4, Bonferroni-adjusted threshold) are shown in the heatmap. e, f Each dot represents one of the tested FDA-approved drugs. Estimated influence of changes in TR activity on drug susceptibility (i.e., λ) and corresponding p-value significance are reported. Dot size is proportional to the number of TRs that exhibit a significant association (linear regression p-value ≤ 2.67e−4, Bonferroni-adjusted threshold) with the drug, while dot color reflects the estimated average susceptibility of renal cell lines (i.e., βkidney) with respect to the remaining seven tissue types

