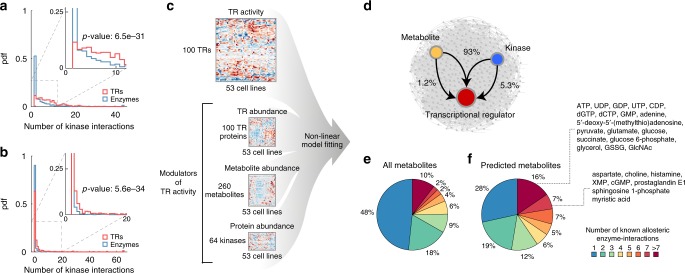
Fig. 5.
Modeling TR activity using an ensemble of non-linear models. a, b Probability density function (pdf) of the number of kinases reported to interact with TRs (red) and metabolic enzymes (blue) in yeast55 (a) and human56 (b). P-values report on the significance of the difference between TRs and enzyme pdfs (Kolmogorov–Smirnov test). c Schematic overview of the computational framework. Three layers of biological information are integrated using a model-based fitting approach: protein abundance of 100 TRs and 64 kinases, respective TR activities derived from transcriptome data using NCA and relative levels of 260 metabolites across cell lines (see Methods section). d Predicted network of modulatory interactions between TRs, metabolites and kinases. Most interactions involve the combined action of a metabolite and a kinase (93% of interactions, Supplementary Data 5). e, f The pie chart represents the distribution of metabolites allosterically regulating one or more enzymatic reactions. All metabolites (1633) with at least one known allosteric interaction in human26 are reported in e, while only metabolites predicted to modulate the activity of at least one TR are shown in panel f. Metabolites that regulate more than seven enzymatic reaction are lumped together

